This is the January 2017 investment conditions report. It includes both a written version and audio commentary.
Listen To The January 2017 Investment Conditions Audio Commentary
The audio commentary is an integral part of the Investment Conditions report as it provides additional context to the written report.
Audio Download
Data Download
The following spreadsheet contains monthly valuation, economic trends and market internal data used in the investment conditions report from December 2015 through December 2016.
Purpose of the Investment Conditions Report
The purpose of the monthly investment conditions report is to objectively look at market valuations, economic and central bank trends, and market internals such as trend, momentum and sentiment data to determine if there is a regime change that suggests investors should make adjustments to their asset allocation and portfolio structure.
In other words, are the risks of bad times in terms of market losses and higher volatility increasing or decreasing.
Monitoring investment conditions is helpful for scaling exposure to risky assets such as stocks as favorable investment conditions generally align with positive investment returns while unfavorable investment conditions have generally been associated with sub-par investment returns.
In this report, investment conditions are segmented into three areas:
- Market valuations – measure how inexpensive or pricey the global stock market and other asset classes are.
- Market internals – measure market trends and momentum and the level fear and greed exhibited by investors.
- Economic and central bank trends – measure the anticipated direction of the economy based on purchasing managers indices (“PMI”) and other indicators and how accommodating central banks are in terms of their interest rate policies.
Market valuations, market internals and economic and central bank trends can be thought of as traffic stoplights that are each individually flashing red, green or yellow.
When all three are red as they were in early 2008, that warrants extreme caution and a more conservative investment approach.
When all three are green as they were in mid 2009 coming out of the Great Recession, then that provides an opportunity to increase portfolio risk and generate higher returns.
Currently, global valuations, economic trends and market internals are YELLOW with investment conditions neutral.
Overall Global Investment Conditions Are Neutral (Yellow)

Investment conditions are neutral or YELLOW as of early January 2017, consistent with the continuation of the cyclical bull market within a secular bull market that has propelled global stock market gains including the 8% return for the MSCI All Country World Index in 2016.
Economic trends continue to improve and have moved into high neutral territory. Bullish stock market breadth and improving momentum have also pushed market internals into the high neutral zone.
Meanwhile, global valuations are on the low side of neutral as global stock appreciation has not been accompanied by earnings growth. Analysts expect global earnings to increase 13% over the next year.
There are early signs inflation is picking up, perhaps leading to less accommodative central bank policies in 2017. Inflation trends and their potential impact on interest rates, asset class valuations and performance are something we will need to monitor closely in the coming months.
Global investors are extremely bullish right now and expectations are high. This means markets are susceptible to a short-term pull back on any political or economic news that might call into question these high expectations.
With global valuations, economic and central bank trends and market internals all rated YELLOW and in neutral territory, investors with a long-term time horizon should keep their portfolio allocations in line with their long-term targets.
It is important to recognize stock markets are part of a complex adaptive system which means unexpected market sell-offs can occur irrespective of investment conditions.
Investors should never have such a large allocation to stocks that their lifestyle or retirement plans would be seriously undermined due to unexpected severe market losses.
You can get examples of how to invest given current market conditions on the Model Portfolios page. You can find more detail on my current allocation and holdings on my Portfolio Profile page.
The remainder of the report provides an overview of market returns and more detail regarding market valuations, market internals and economic and central bank trends.
Market Returns
After a rocky start to the year and some notable volatility following both the Brexit vote and the U.S. presidential election, global stocks ended 2016 with solid returns.
The MSCI All Country World Index returned 7.9% for the year led by strong performance for the U.S., which gained 10.9%. The U.S. market kept to its pattern of returning double digits in the year following a year of weak performance (i.e. returns less than 5%) during secular bull markets. The U.S. comprises 52% of the MSCI All Country World Index so it has a disproportionate impact on the global benchmark’s returns.
Emerging markets also returned double digits for the year, contributing to solid return for the All Country World Index.
The United Kingdom returned 19% for the year in pounds but that gain was wiped out in its entirety in U.S. dollar terms due to the weakening pound.
76% of countries (i.e. 35 out of 46) that comprise the MSCI All Country World Index posted positive total returns in 2016 in local currency terms.
The following table provides an overview of equity market returns:
Global Stock Market Returns For the Periods Ending December 31, 2016

Source: MSCI
Bond Market and Income Strategy Returns
Most bond markets around the world were negative in the fourth quarter due to rising interest rates but still managed to finish 2016 in positive territory.
Non-investment grade bonds were the best performers for the quarter and year as their yields fell throughout the year due to indications of strong economic growth and the rebound in oil prices that reduced expected default risk for high yield bonds.
Global high yield bonds returned 14% for the year while U.S. non-investment grade bonds returned 17%.
Emerging market bonds also performed well in 2016 despite lackluster returns in the fourth quarter, returning close to 10% for the year in U.S. dollar terms.
The following table provides an overview of bond market returns:
Fixed Income Returns For the Periods Ending December 31, 2016
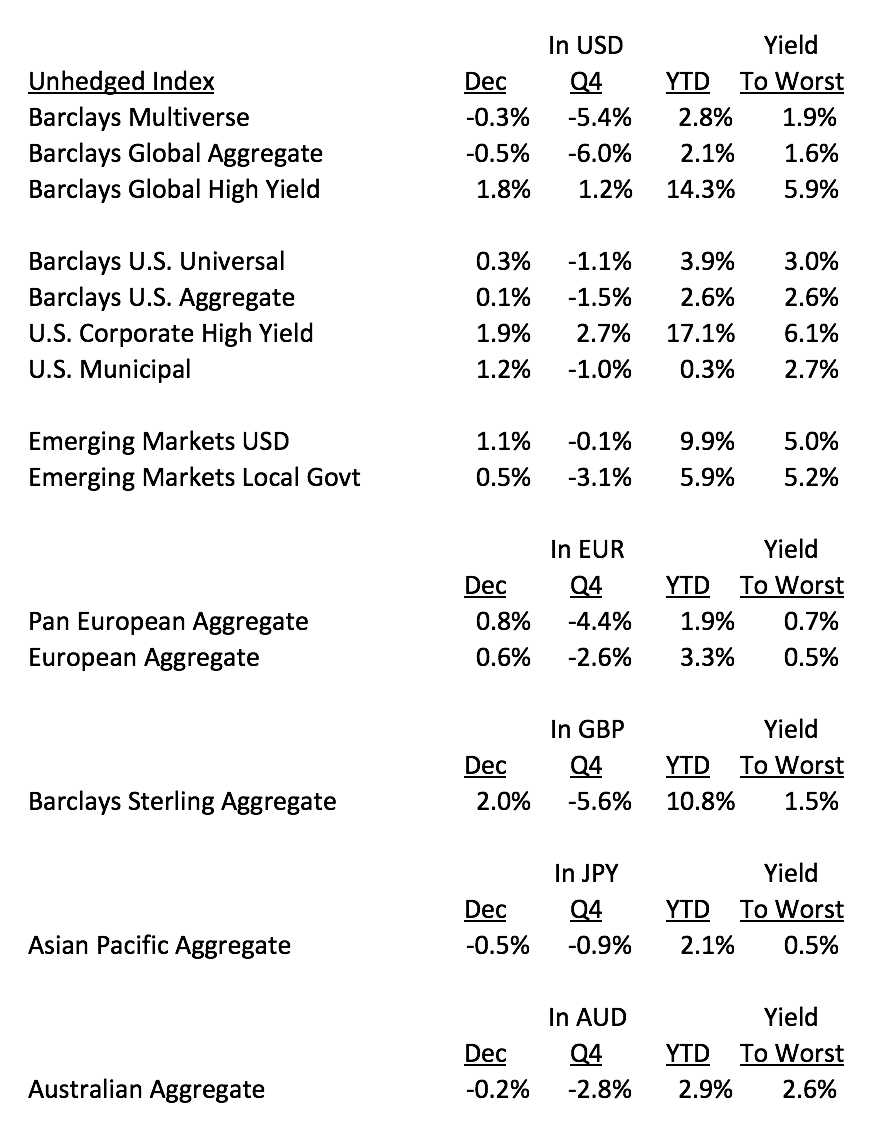
Source: Barclays
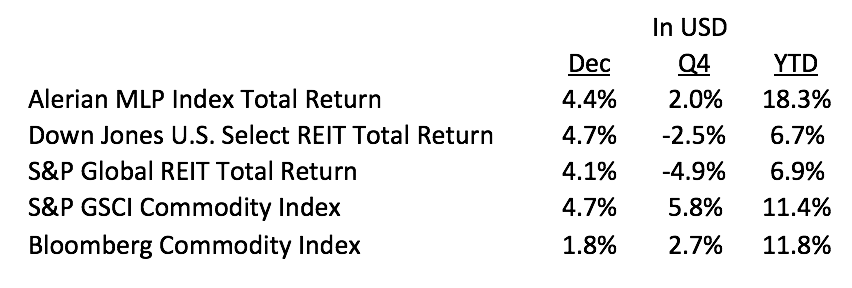
Income strategies rebounded strongly in December with REITs, MLPs and some commodity benchmarks returning over 4% for the month.
For the year, MLPs were the strongest performer returning over 18% after a brutal sell-off in 2015.
REITs ended the year with returns close to 7% while commodities returned 12%.
MLPs, REITs and Commodities Returns For the Periods Ending December 31, 2016
Market Valuations – YELLOW

Market valuations remain on the low side of neutral as of early January 2017 with valuations similar to last month.
A global corporate earnings recession with earnings falling 15% year-over-year through early January has led to increased stock market valuations, although most companies have not reported their fourth quarter earnings, which are expected to show improvement.
The earnings yield for the MSCI All Country World Index declined to 4.8% in early January 2017 from 5.6% a year ago. The lower the earnings yield, the higher the valuations.
A rebound in corporate profits would not only improve valuations but support the continuation of the global secular bull market in stocks. Analysts expect global earnings to increase 13% over the next year.
The U.S. and the U.K. saw some of the biggest increase in valuations in 2016 as both countries recorded double digit equity returns while earnings fell. Analysts expect both countries to post double digit earnings growth in the coming year. In the meantime, the U.S., the U.K. and Canada remain pricey.
The following tables provides an overview of valuations for various regions and select countries. The higher the yield in terms of earnings and dividends, the more attractive the valuation.
Equity Valuations as of January 1, 2017
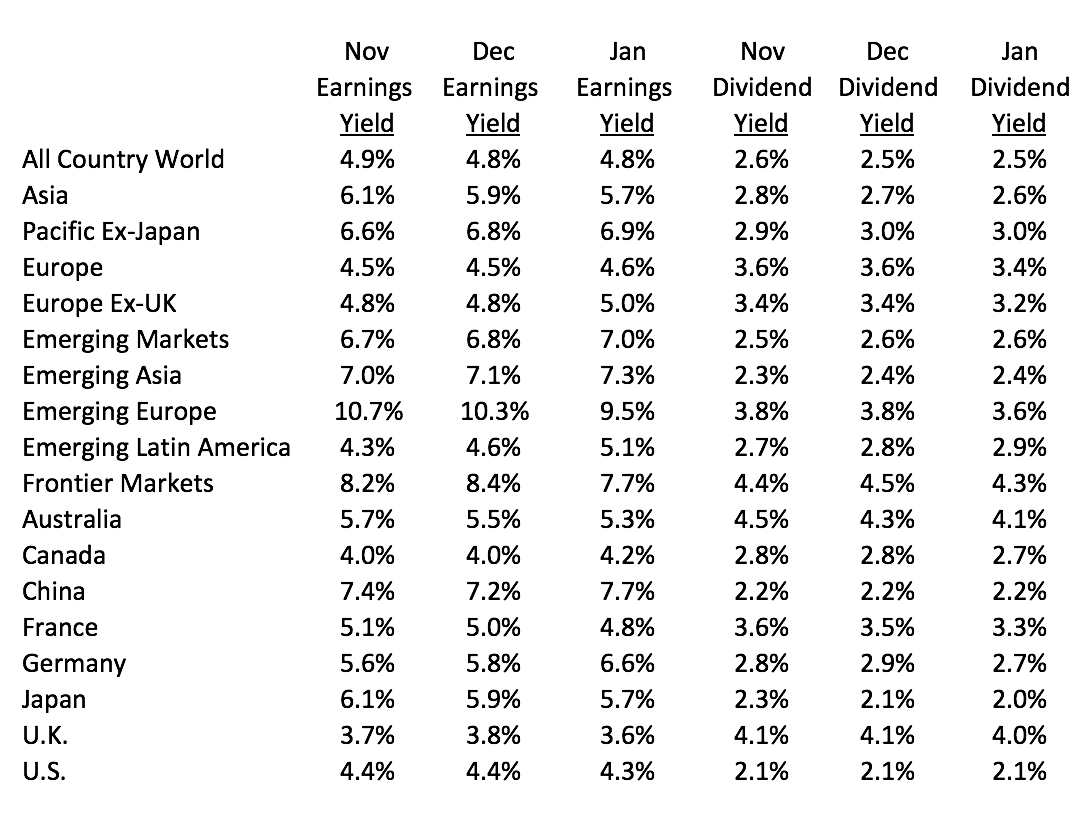
Based on trailing twelve month earnings and dividends.
Source: Ned Davis Research
Equity Cyclically-Adjusted Price-to-earnings Ratios
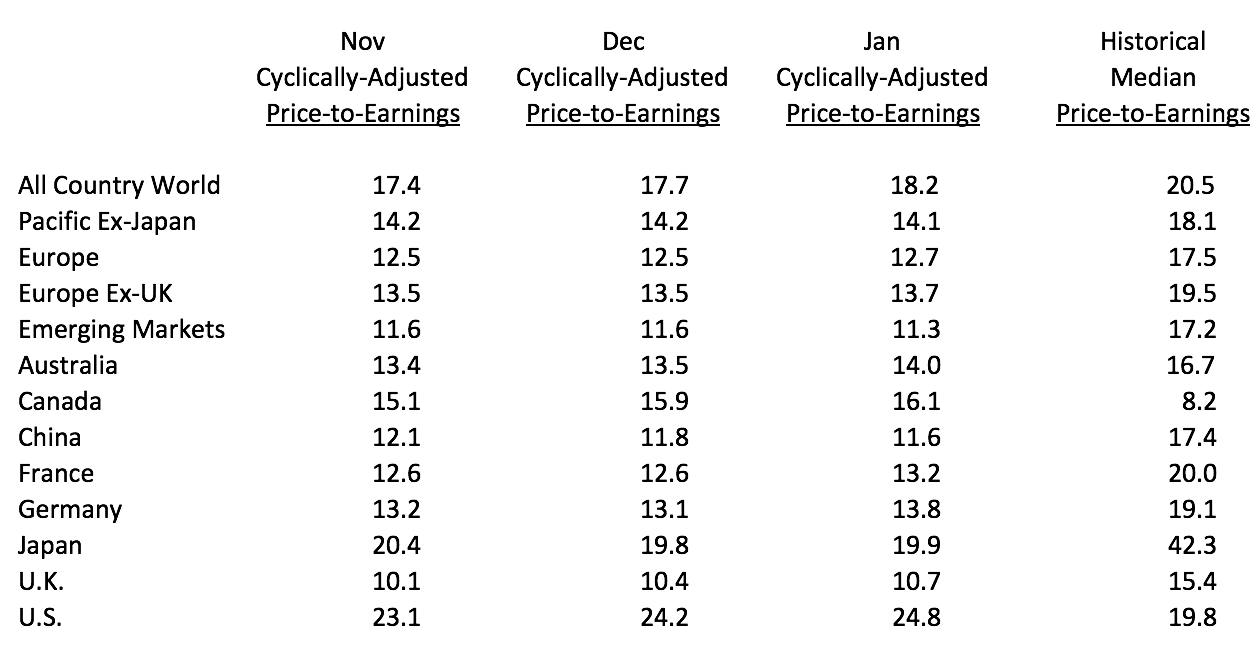
Source: Ned Davis Research, MSCI
Note: Cyclically-adjusted P/E Ratios are based on previous 10 year average earnings using MSCI Indices. One important consideration when making valuation judgements using 10-year earnings is whether the previous decade reflects the earnings potential going forward. In other words, are their outliers in the historical earnings record that are not repeatable?
The following section provides some additional valuation metrics for select U.S. bond and income strategies.
Select Bond and Income Strategy Valuations as of January 1, 2017
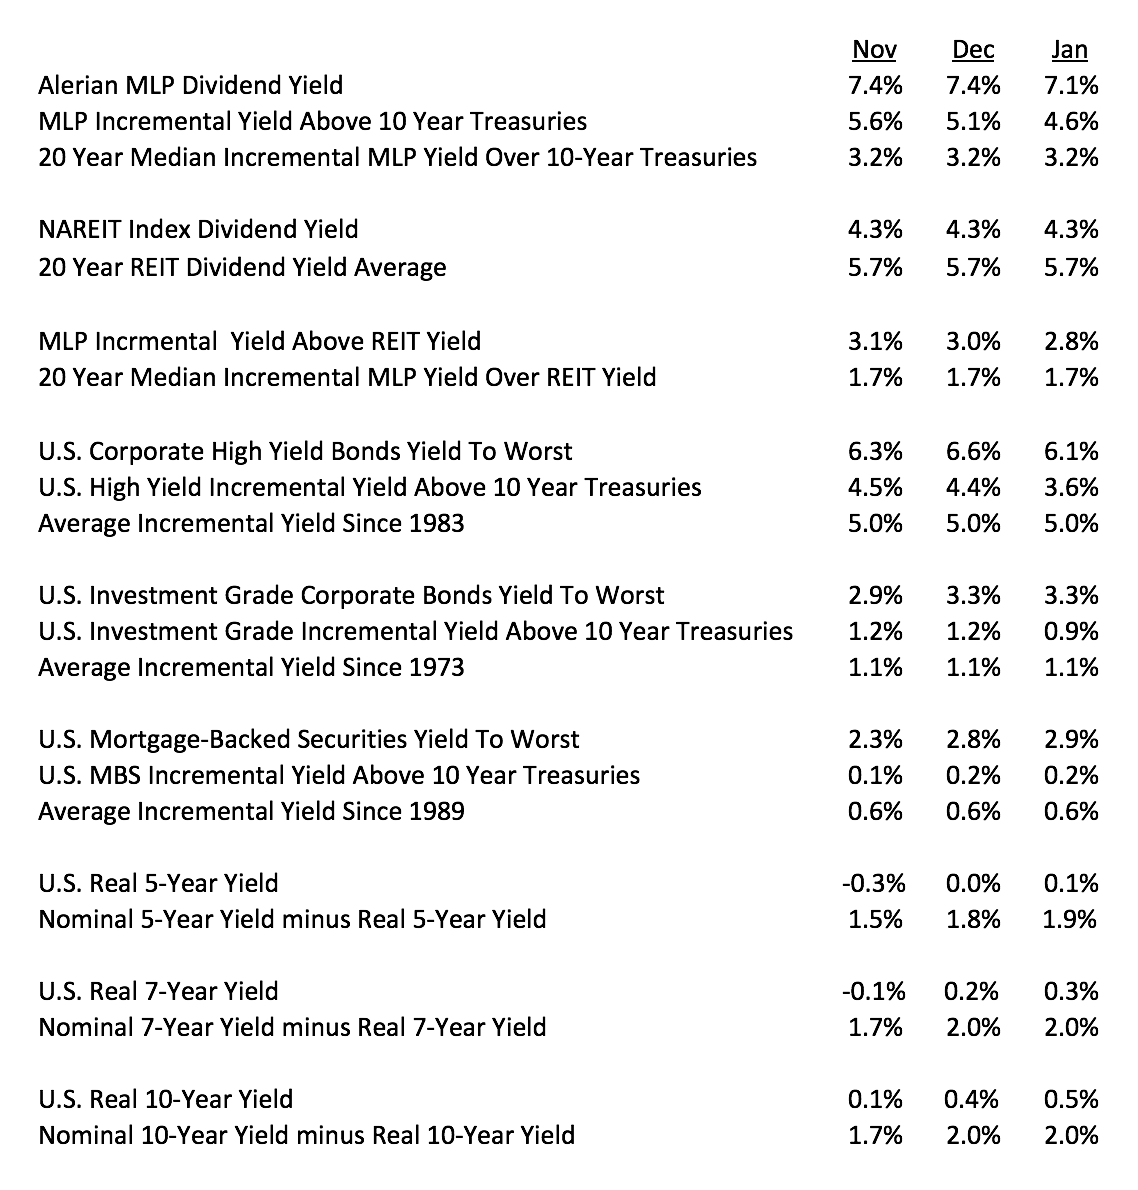
Source: Ned Davis Research
Strong returns for a number of income oriented strategies have seen their yields decline.
For example, the rebound in MLPs saw their yields fall from 8.6% in April 2016 to 7.1% by year-end. Meanwhile with interest rates rising, the incremental yield of MLPs relative to 10-year Treasury bonds fell from 6.9% in April 2016 to 4.6% by year-end. The yield advantage remains above the long-term average of 3.2%.
Real estate investment trust yields ended the year at 4.3%, the same level they were in December 2015.
Consequently, valuations have held steady with yields remaining below their long-term averages. The 7% return in 2016 for REITs reflects their income payout combined with dividend growth and little in the way of valuation changes.
Global and U.S. non-investment grade bond yields fell to 6% at year-end from 8% at the beginning of 2016, allowing the asset category to post double digit returns.
With interest rates on U.S. Treasuries rising while U.S. high yield bond yields have declined, the yield advantage for non-investment grade bonds relative to Treasuries has fallen from 6% down to 3.6%, below the long-term average of 5%.
With recovery rates down significantly for defaulted bonds, the lower yields make non-investment grade bonds less attractive.
Economic and Central Bank Trends – YELLOW

The most robust data set for understanding global economic growth trends is Purchasing Manager Indices (PMIs), which are monthly surveys of businesses conducted by Markit and other providers.
There are both Manufacturing and Non-Manufacturing PMI surveys conducted each month. Generally, a reading above 50 suggests an economy is expanding while a reading below 50 suggests an economy is contracting.
This report focuses on Manufacturing PMIs as they have a longer and more accurate history of predicting global recessions.
The following table provides an overview of global PMI as well as select regions and countries.
PMI Data As of January 1, 2017
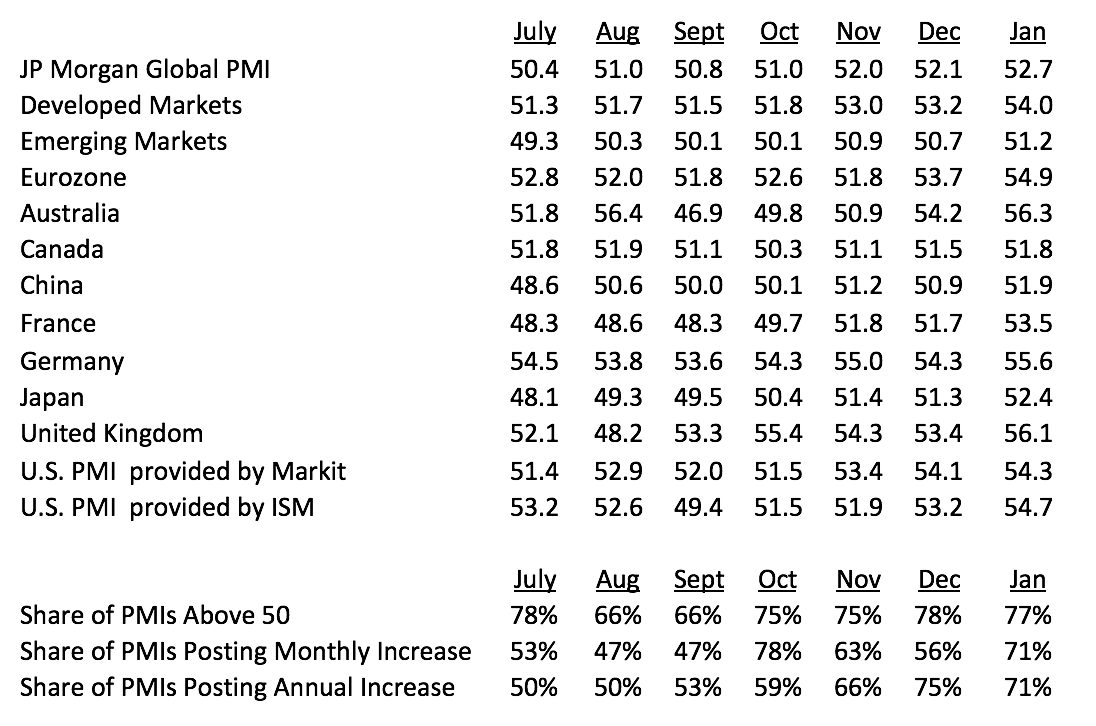
Source: Markit, ISM and Ned Davis Research
Global economic conditions improved in December with the JP Morgan Global Manufacturing PMI gaining 0.6 to 52.7, its highest level since February 2014.
Output rose to its best level in two and a half years while new orders climbed to their highest level since July 2014. New export orders were at 27-month high, while employment rose to its best level since August 2011.
The JP Morgan Global Composite PMI that includes both services and manufacturing came in at 53.4, just below its long-term average of 53.7.
On a more sober note, the pick up in the economy is creating some pricing pressures as businesses ranked their input prices at the highest level since 2011. Year-over-year increases in wages for U.S. workers rose by 2.9%, the highest annual increase since 2009.
PMI breadth was good with 71% of countries posting a PMI increase for the month and 71% of countries showing PMIs above their level from a year ago.
77% of countries have PMIs in expansion territory, suggesting economic growth is broadening as it approaches the 80% threshold typically seen with more robust global expansions.
The U.S. Federal Reserve raised interest rates at their December meeting and with inflation pressures increasing it is possible other central banks will be less accommodative in 2017.
Inflation trends and their potential impact on interest rates, asset class valuations and performance are something we will need to monitor closely in the coming months.
Market Internals – YELLOW
Market internals, such as trend, momentum, and sentiment, are fast variables since they are driven by investor emotion whereas valuations and economic trends tend to change more slowly.
At times, market internals can act as an accelerant that magnifies the prevailing long-term secular trend that is driven by valuations and economic and central bank trends.
At other times, market internals can dampen the prevailing long-term trend.
Adjusting investment portfolios based exclusively on market internals is a trading strategy that can be effective, but is not compatible with the longer-term focus of the Money For the Rest of Us Hub.
Instead, we can combine the faster variables of market internals with the slower variables of valuations and economic and central bank trends in order to identify regime changes that suggest the risk of a major equity market sell-off is high or, conversely, conditions are in place for a major equity market advance.
Market internals are essentially a swing vote that reinforces or dampens the primary message coming from the slow variables of market valuations and economic and central bank trends.
The following table provides and overview of prevailing global market trends, which measure the direction of markets:
Global Equity Market Trend Data as of January 1, 2017
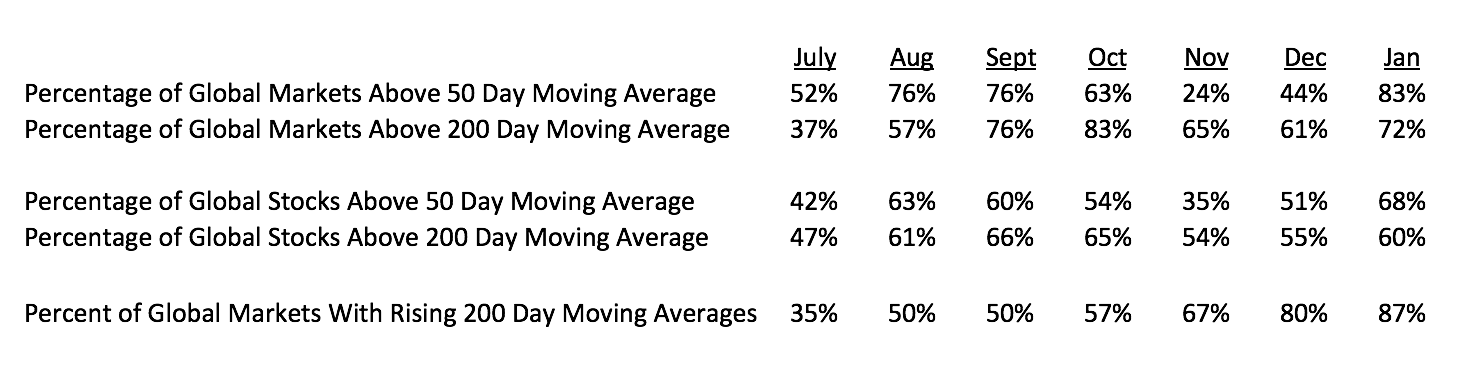
Source: Ned Davis Research
Market internals improved in December with solid breadth as the majority of markets are in an uptrend. 72% of markets trade above their 200 day moving averages while 87% show rising 200 day moving averages, the best level since September 2015.
While trend measures the direction of markets, momentum data measures the rate at which markets change. Momentum data is on the high side of neutral.
One note of caution is the global investors are extremely bullish right now and expectations are high. This means markets are susceptible to short-term pull back on any unexpected political or economic news that might call into question the high expectations.
Summary
As of early January 2017, global valuations, economic and central bank trends and market internals are all rated YELLOW and in neutral territory.
This suggests investors with a long-term time horizon should keep their portfolio allocations in line with their long-term targets.
The following tables provides a summary of market conditions by region.
