This investment strategy report is also available in audio format in the Plus member audio feed.
Become A Member
If you would like to access this investment strategy report, you can do so by becoming a Money For the Rest of Us Plus member.
Learn More About Membership Options »
You can view a printable version of the investment conditions here.
Investment conditions reports from earlier periods can be found here.
What Happened?
Global stocks returned 22% in 2025, following a 1% gain in December, as measured by the MSCI All Country World Index. It was the third consecutive year of double-digit returns for global equities. The 2025 gain matched the 22% return posted in 2023.
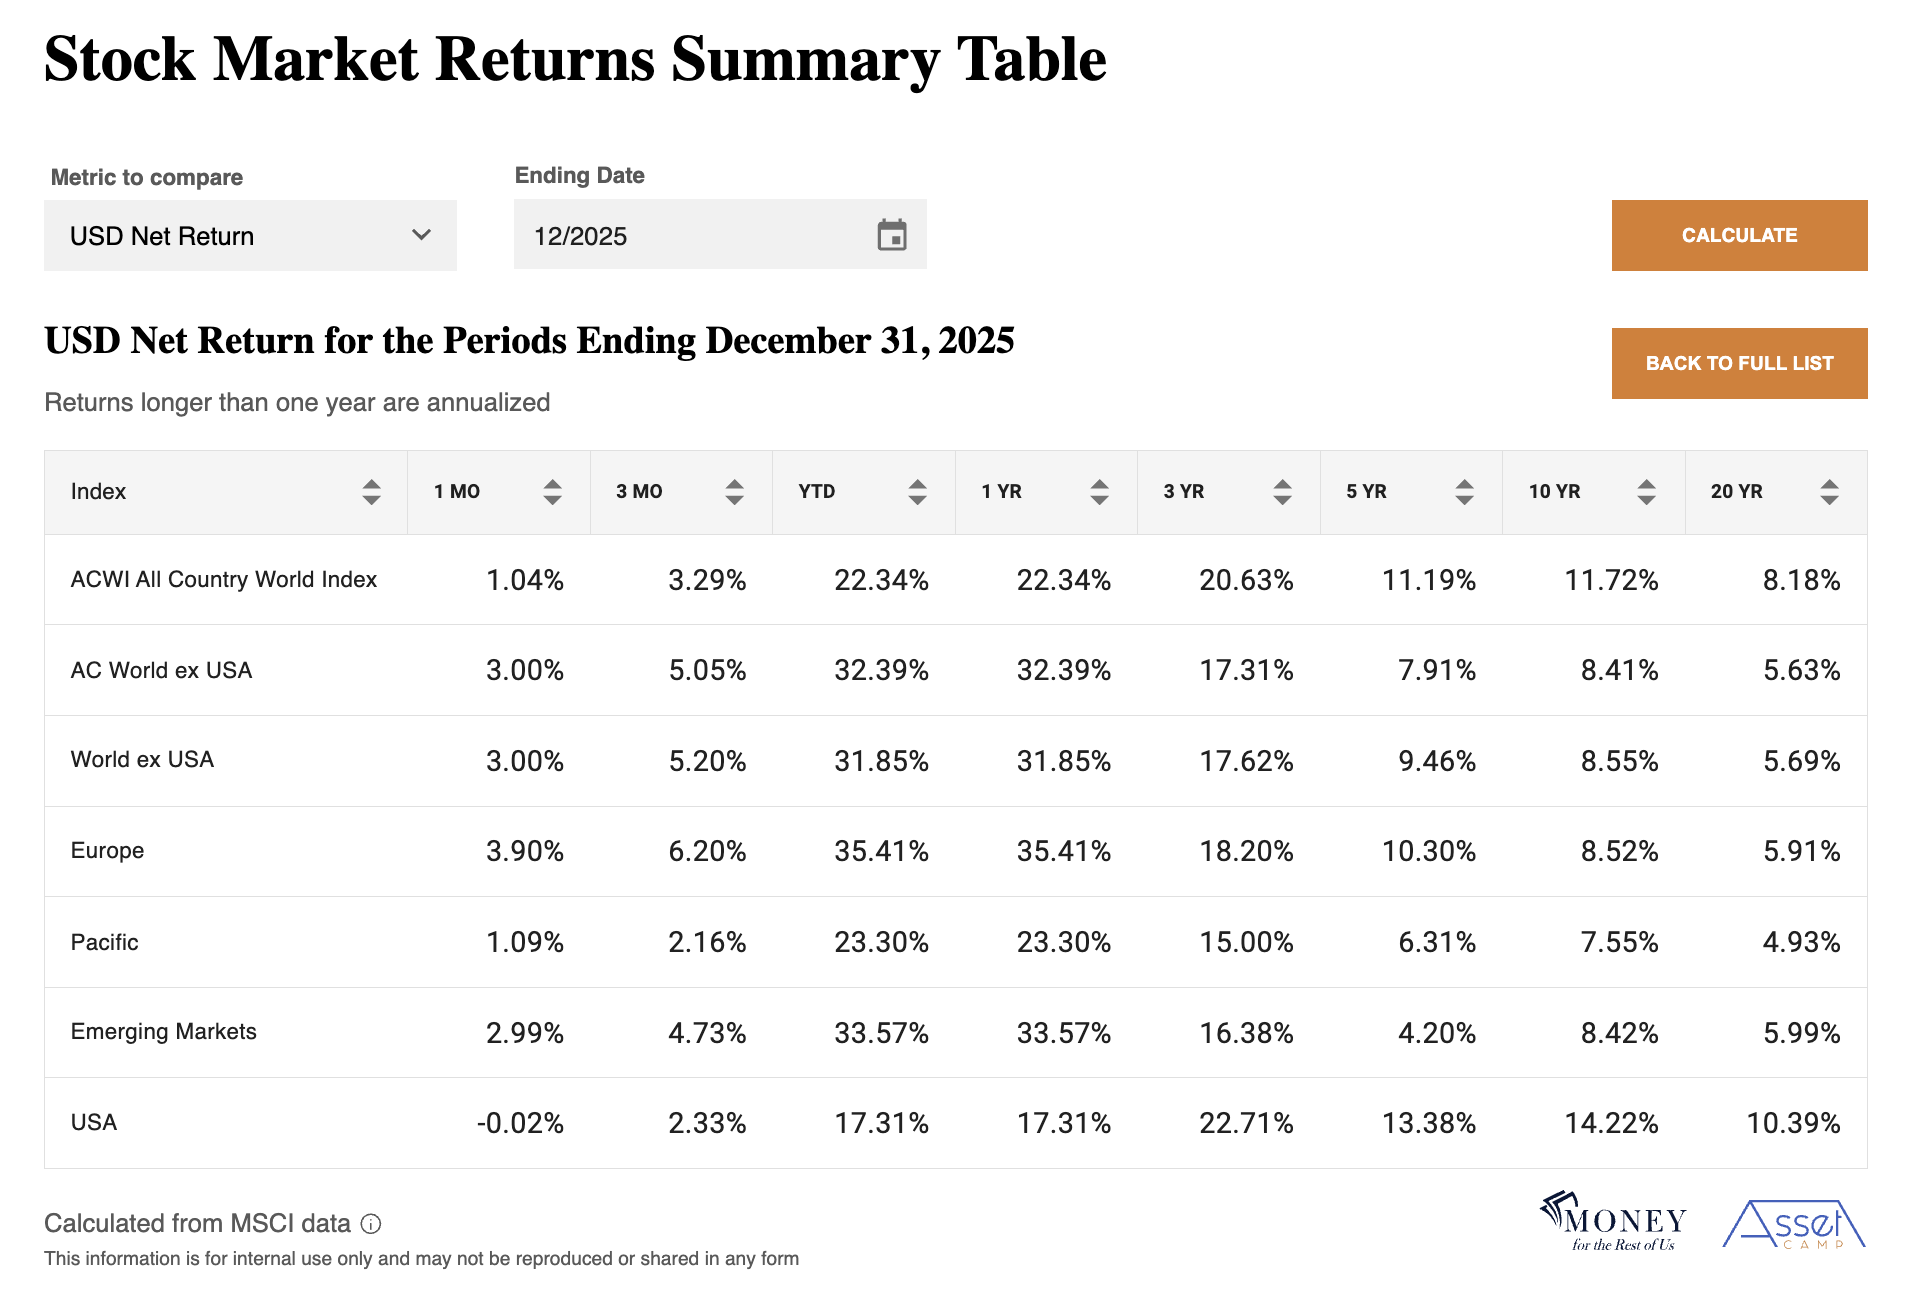
What differed in 2025 was the performance of U.S. stocks. With a 17% return, U.S. equities lagged most major stock indexes. In contrast, in 2023, U.S. stocks were the third-best-performing index, trailing only U.S. Growth and Emerging Markets Latin America.
In 2025, non-U.S. stocks, including emerging markets, outperformed U.S. stocks by 15% points in U.S. dollar terms and by 7% points in local currency terms. A weaker U.S. dollar boosted non-U.S. stock returns by roughly 8% when translated into U.S. dollars.
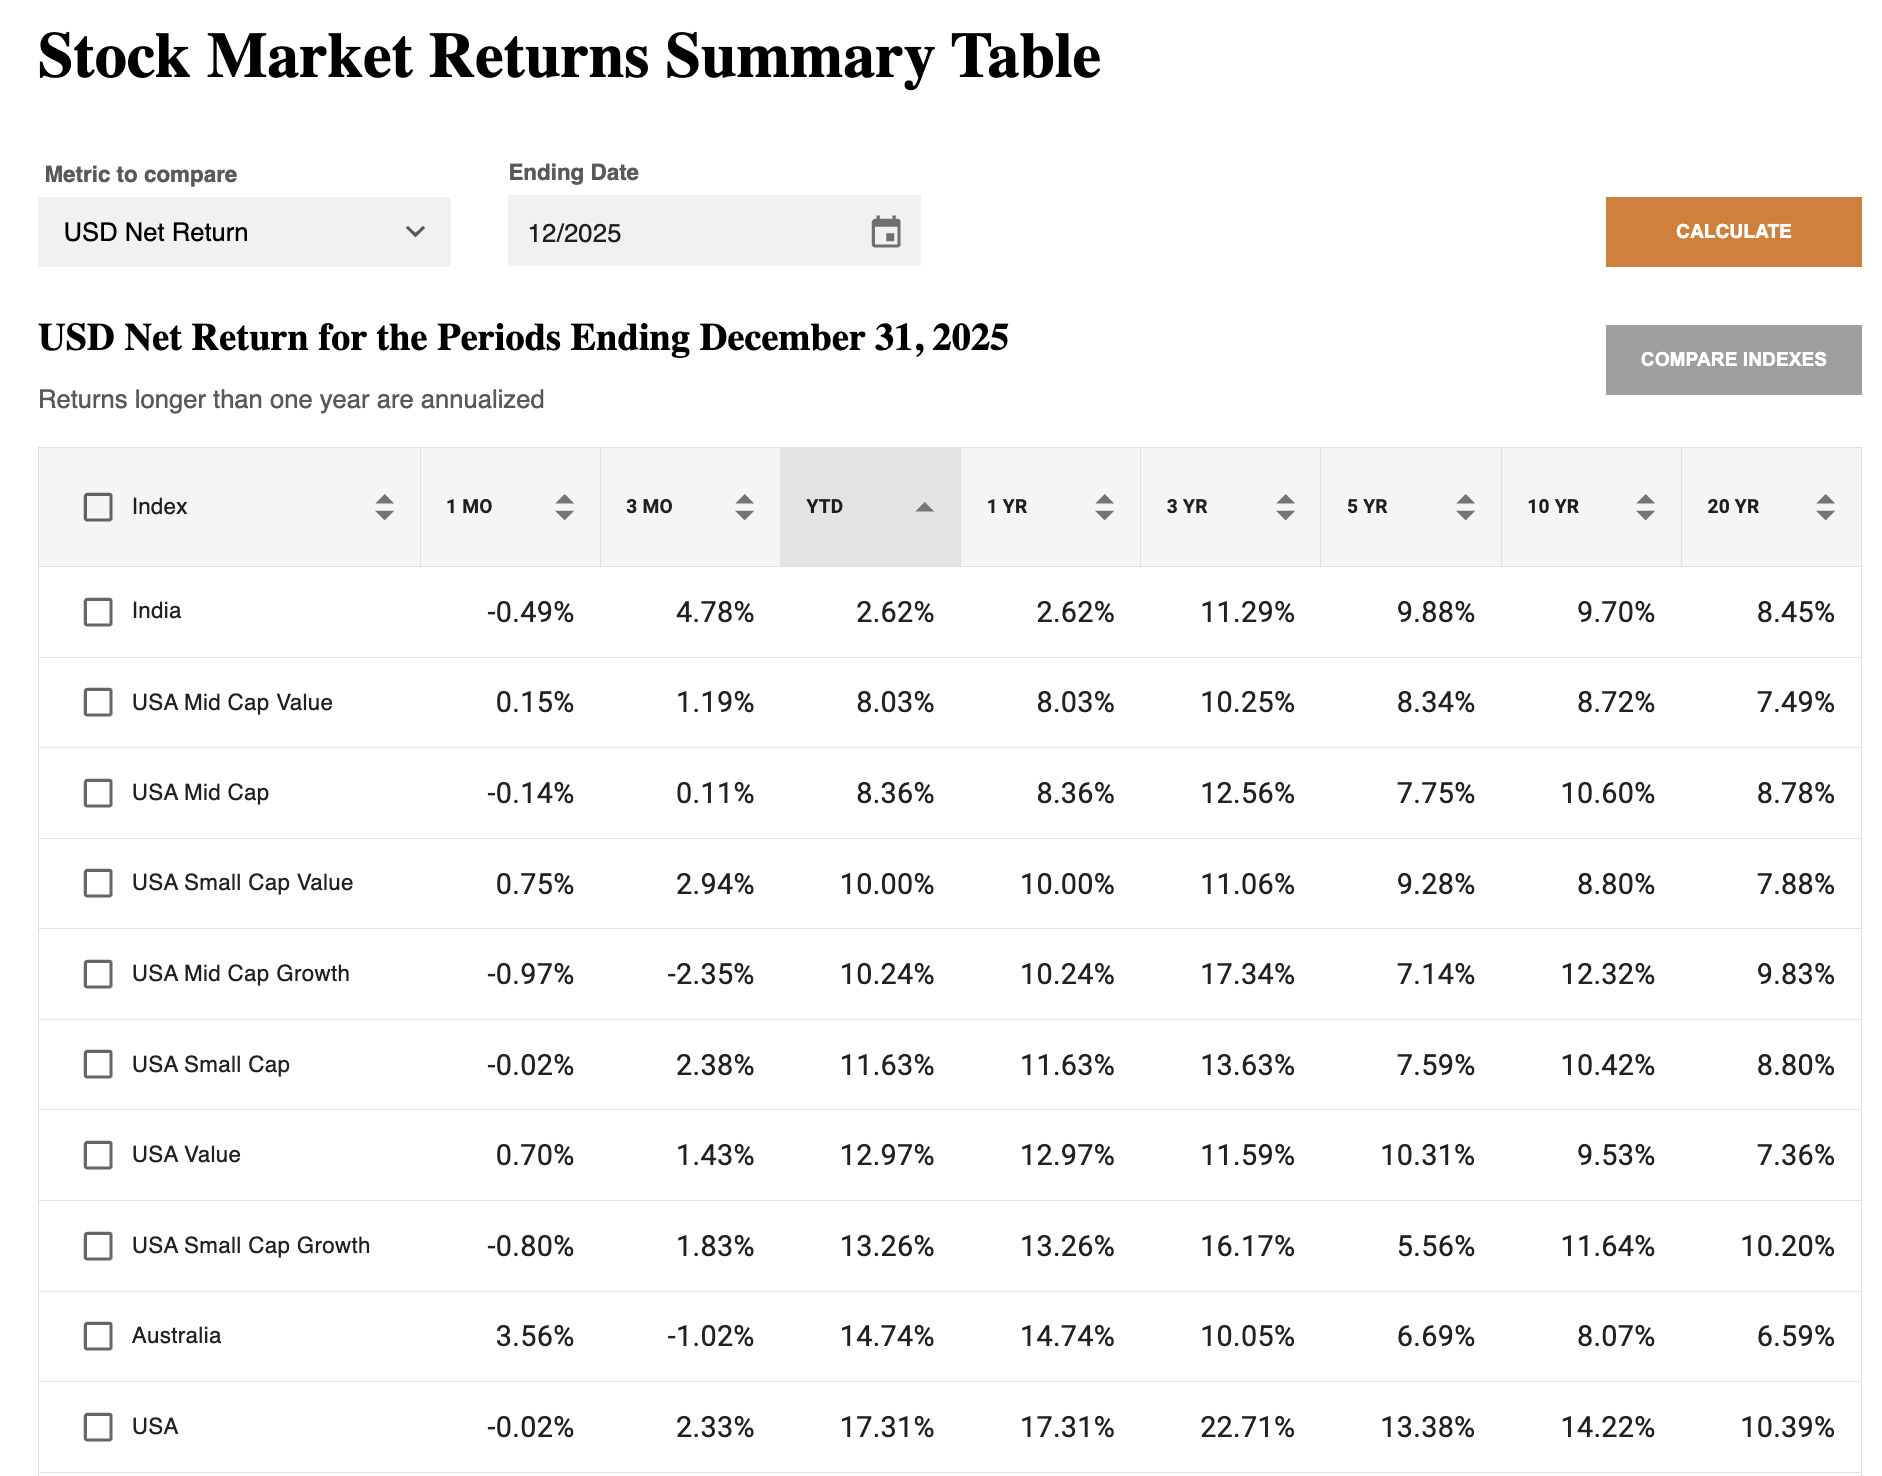
The top ten best-performing stock indexes returned over 30% in 2025, led by emerging and frontier markets, Europe, and non-U.S. value strategies.

Eight of the ten worst-performing stock indexes in 2025 were U.S. benchmarks.
Bond Market Update
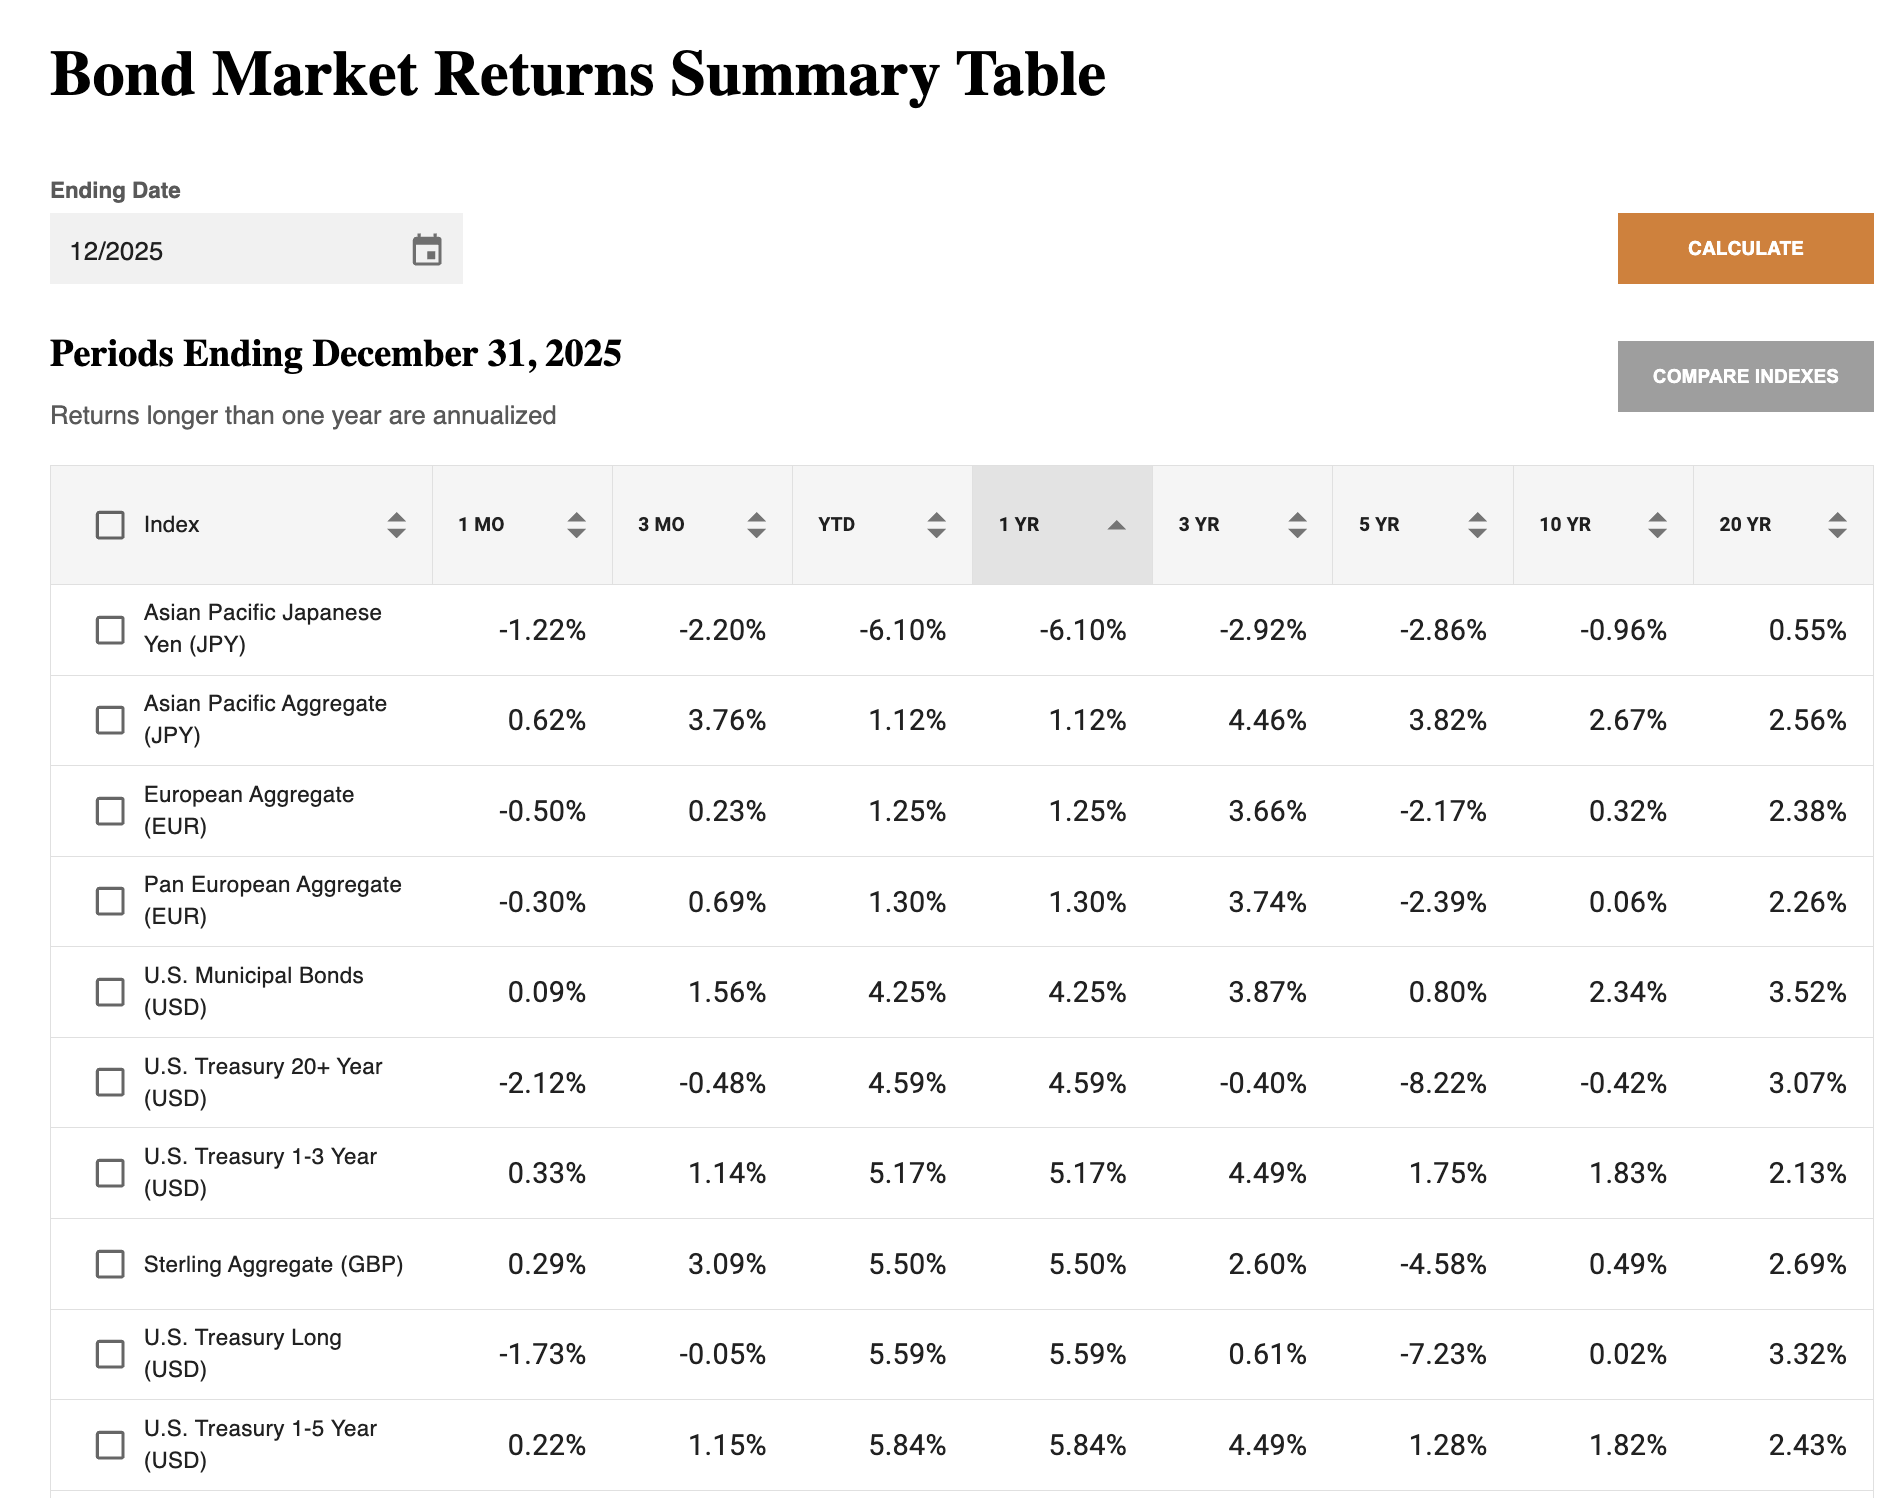
Global bonds priced in U.S. dollars returned over 8% in 2025, outperforming U.S. bonds by 0.8%. A weakening U.S. dollar boosted returns for non-U.S. bonds when translated into U.S. dollars.
U.S. bonds returned 7.3% in 2025, benefiting from falling interest rates, as yields on the U.S. Treasury Index declined by 0.6% in the year.

The best-performing bond indexes in 2025 were non-investment-grade and emerging-market bonds. Those segments benefited from both falling absolute yields and narrower credit spreads relative to U.S. Treasury bonds.

The worst-performing bond indexes in 2025 were Japanese and European bonds. Interest rates in Japan and Europe rose by 0.2% to 0.9%, resulting in negative returns for Japanese bonds and returns of around 1% for European bonds.
One contributor to the weakening U.S. dollar in 2025 was the narrower yield differential between the U.S. and developed nations, as U.S. interest rates fell while rates in Japan and Europe rose.
Where Are We Now
Over the past five years, U.S. stocks have returned 13.4% annualized, compared to 10.3% for non-U.S. stocks, including emerging markets, when measured in local currency terms. In U.S. dollar terms, non-U.S. stocks have returned 7.9% annualized.
Those strong returns were driven by robust earnings-per-share growth of 15.5% annualized for U.S. stocks and 13.3% for non-U.S. stocks (in local currency), as earnings rebounded from the pandemic-era trough.
Dividends also contributed, averaging about 1.3% per year for U.S. stocks and 2.6% for non-U.S. stocks.
Over the past five years, the combined contribution from earnings per share and dividends exceeded the annualized returns for both U.S. and non-U.S. stocks. Mathematically, this implies that valuations declined over the period. The trailing 12-month P/E ratio for U.S. stocks fell from 32.2 five years ago to 27.8 today.

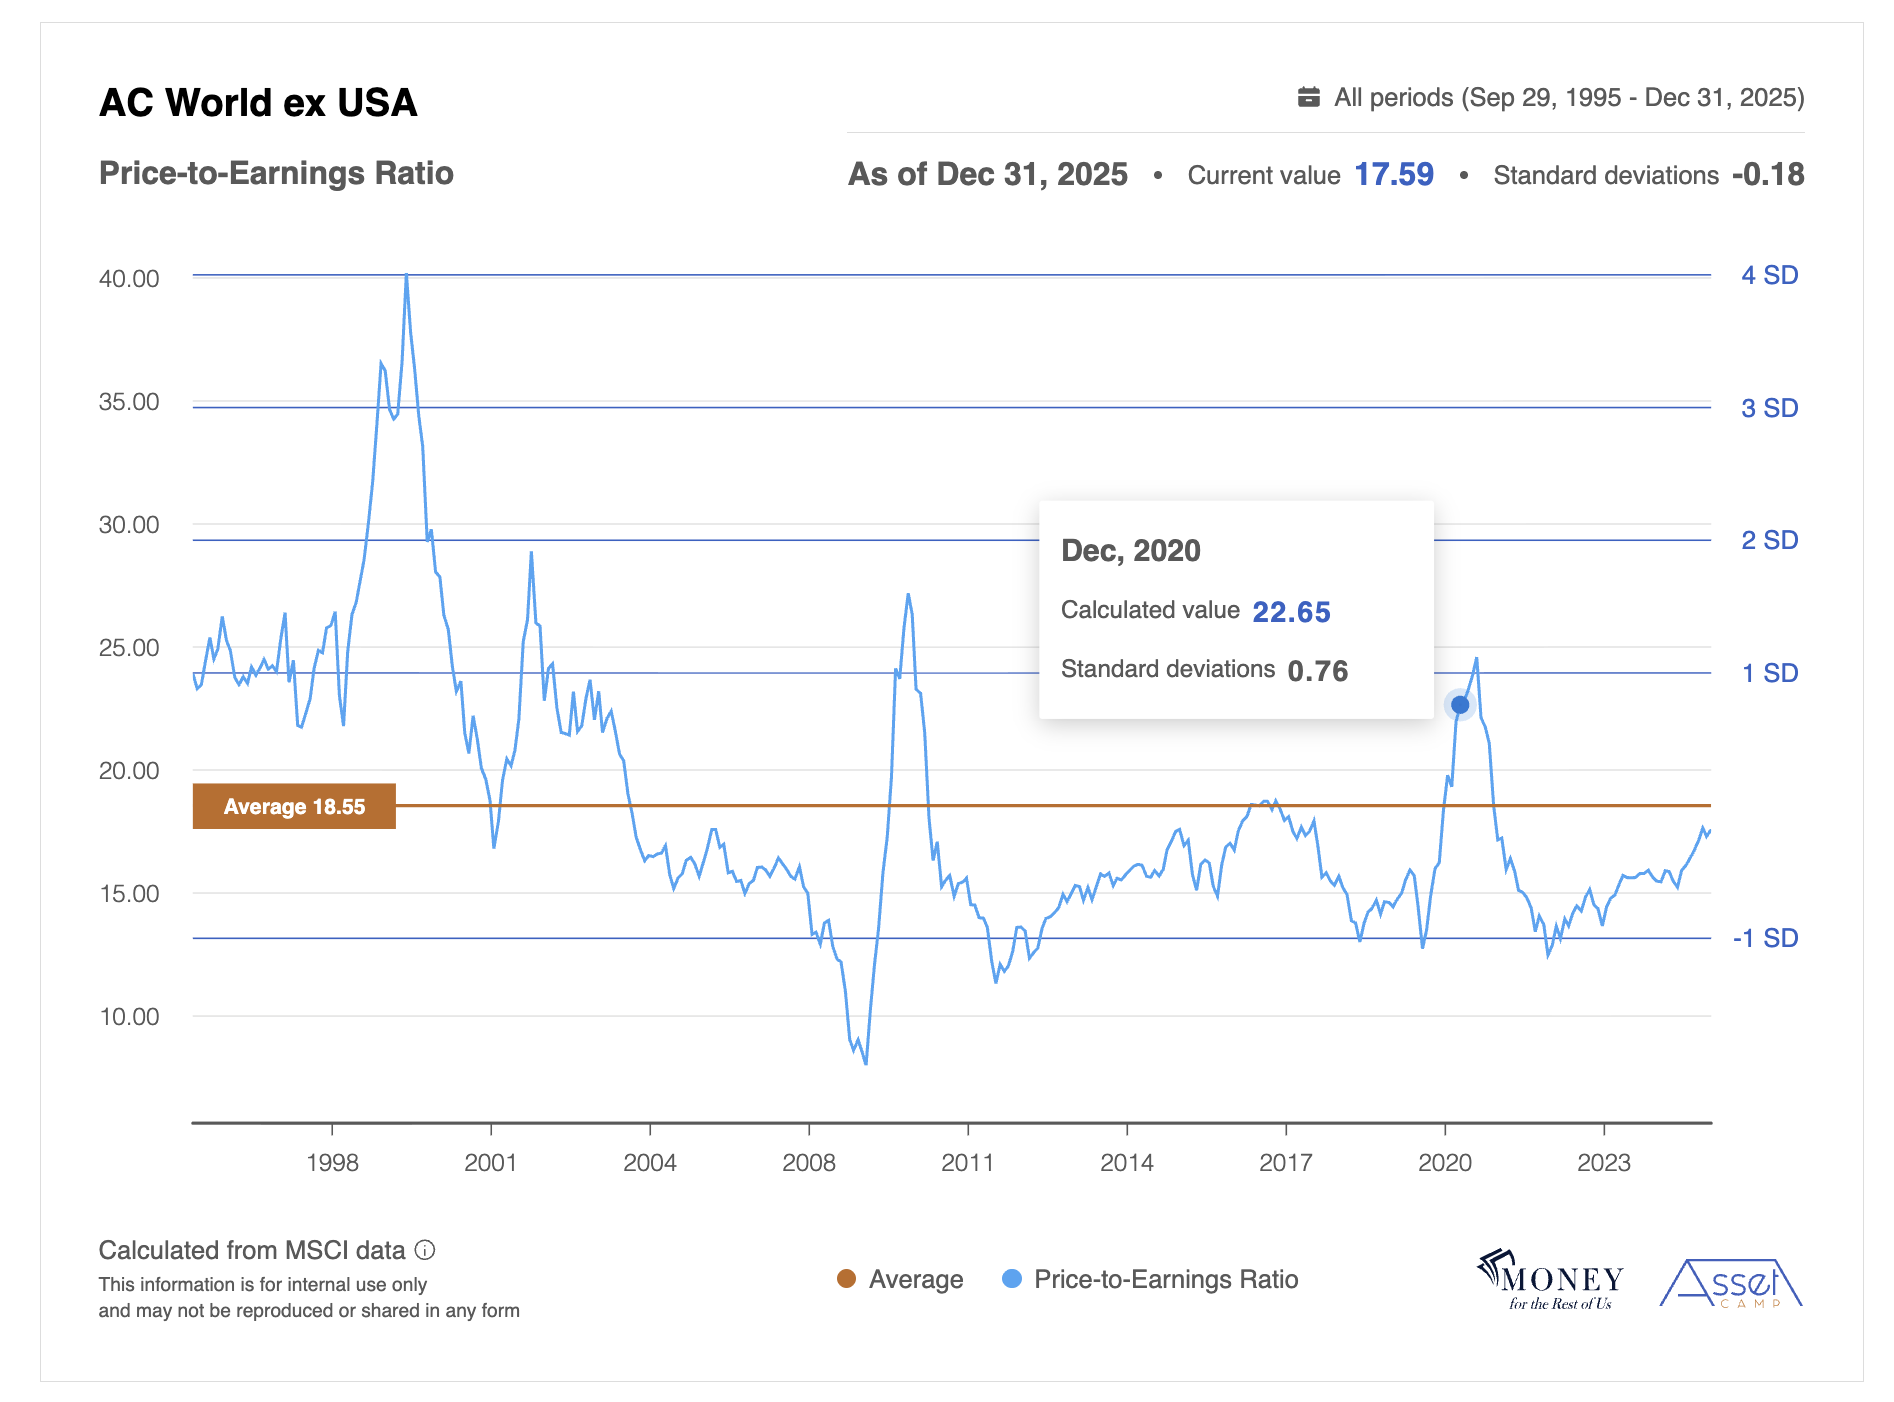
Non-U.S. stocks saw a similar valuation compression, with trailing 12-month P/E ratios falling from 22.7 five years ago to 17.6 today.
The challenge for stocks going forward is whether they can sustain elevated earnings-per-share growth after such a strong five-year period.
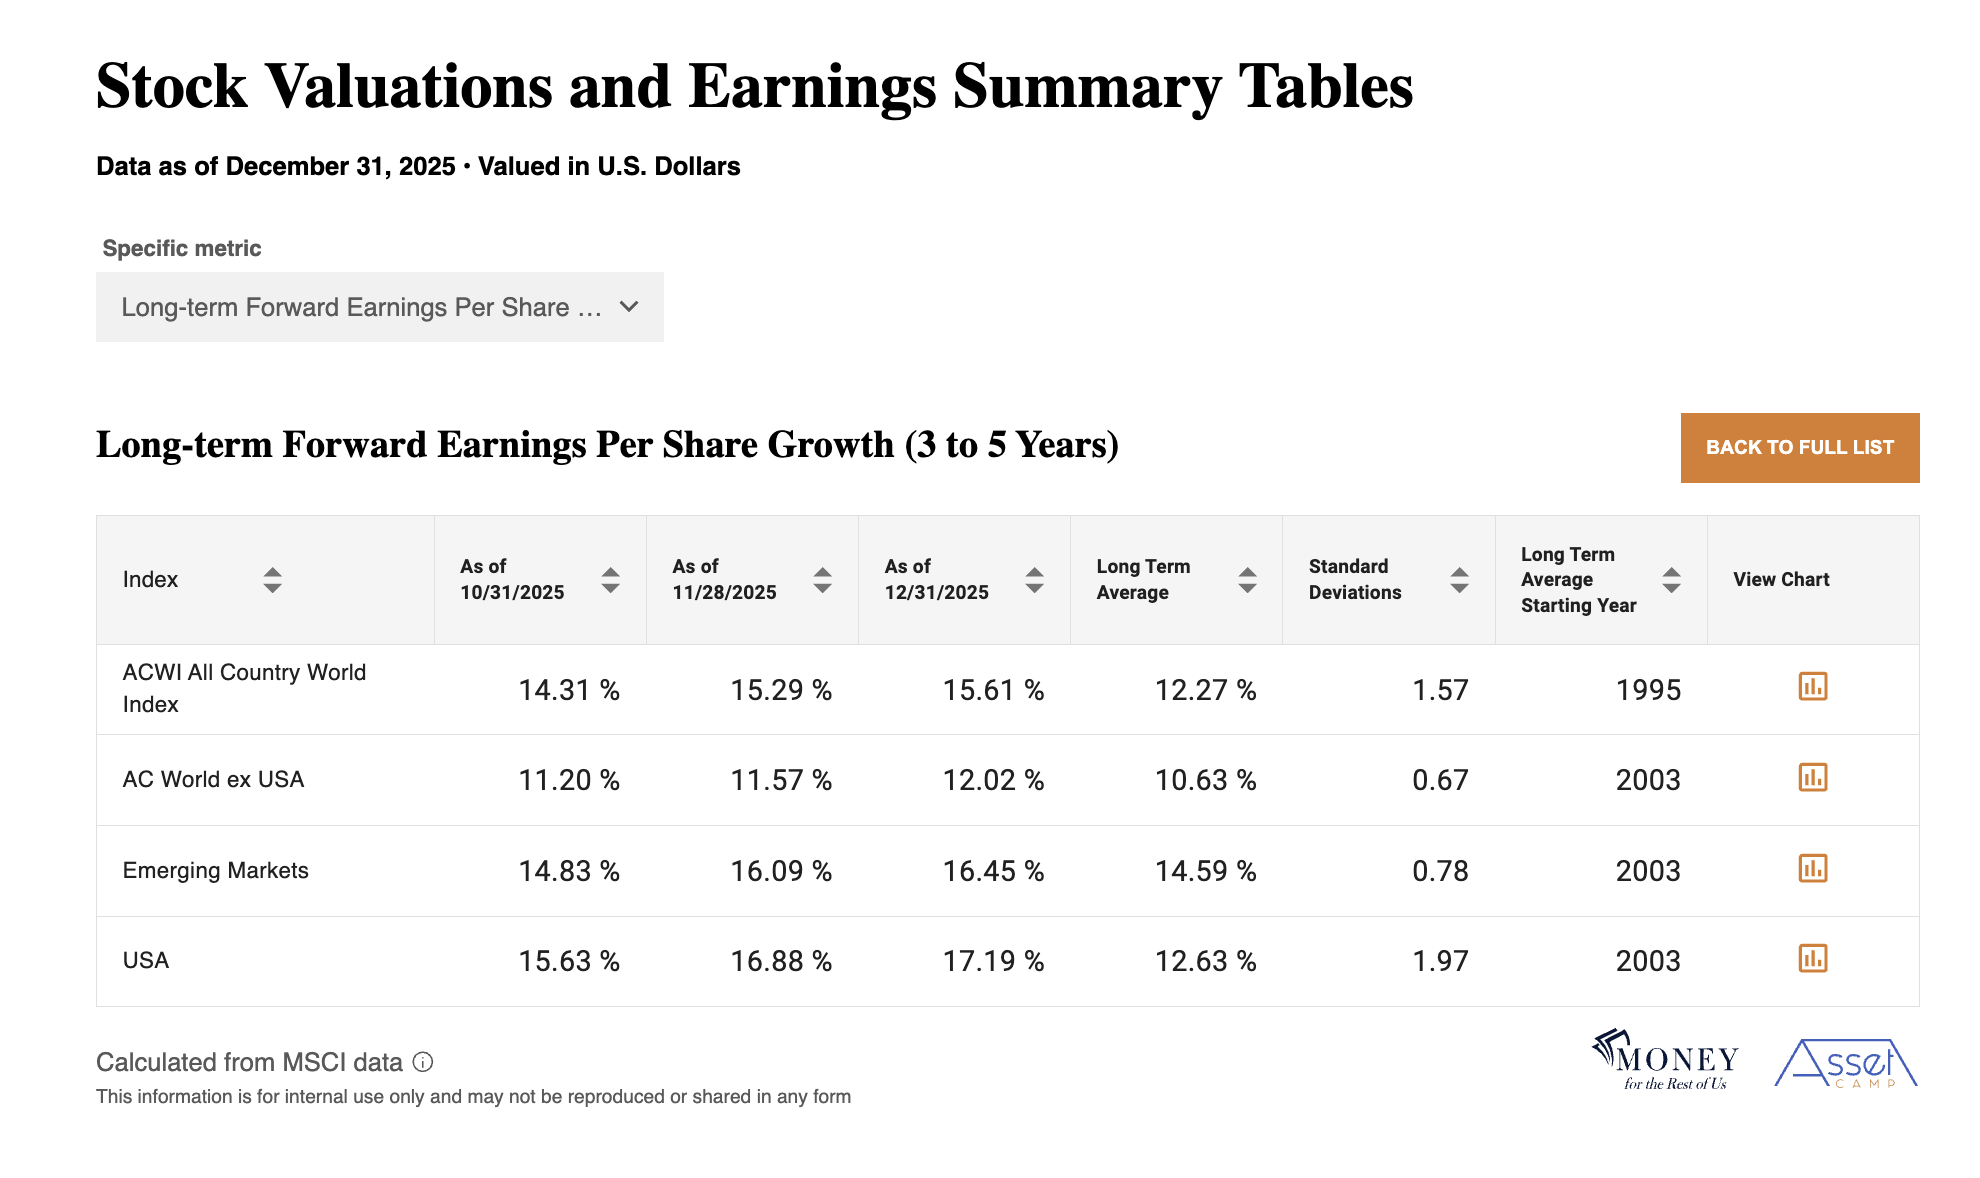
Sell-side analysts believe they can, based on aggregated bottom-up company-by-company earnings estimates. Global earnings per share is expected to grow 14.1% over the next year and 15.6% over the next three to five years.

The Impact of Budget Deficits on Corporate Earnings
An often overlooked contributor to above-average earnings growth is the impact of large federal budget deficits on corporate profits.
Corporate profits are essentially corporate savings, defined as income minus expenses. In this sense, they are analogous to household savings, which is also income minus expenses.
Across the economy, one entity’s spending becomes another entity’s income. When a household or business makes a purchase, it records an expense, while the seller records revenue.
For households and businesses to save in aggregate by spending less than their income, the federal government must dissave by spending more than it receives in tax revenue. In other words, the government must run a budget deficit.
We highlight this accounting identity because it is difficult to ignore the impact of the expanding U.S. federal budget deficit on corporate profit growth.
Ten years ago, the U.S. federal budget deficit was $440 billion. In fiscal year 2025, which ended last September, the deficit totaled $1.8 trillion. It reached $3.1 trillion in 2020.
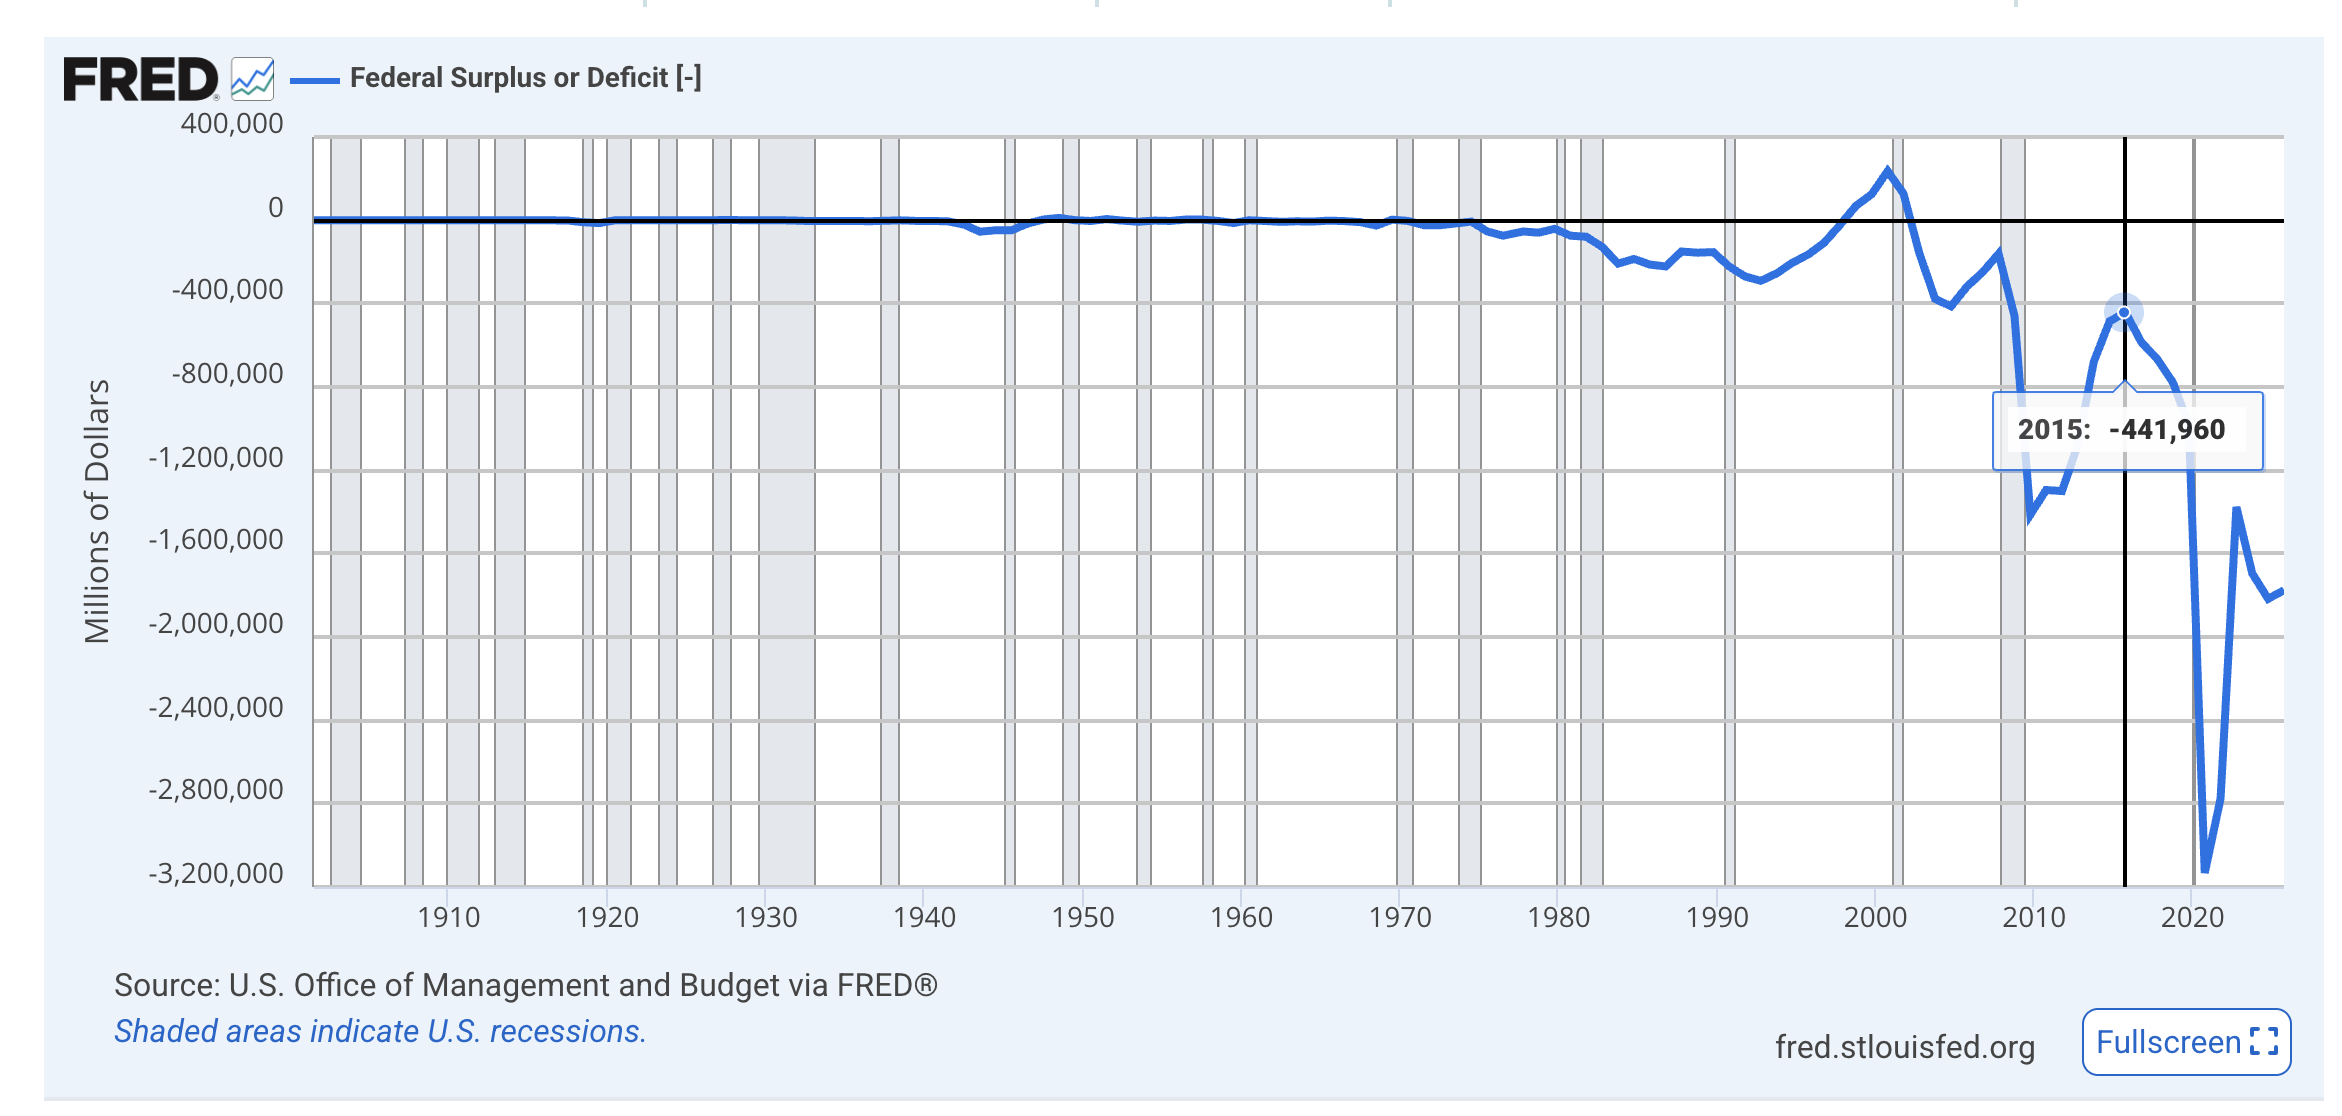
Over the past decade, the cumulative U.S. budget deficit was $15.5 trillion, double the $7.6 trillion total deficit recorded from 2005 to 2015.
Given this doubling of the budget deficit, it is not surprising that U.S. earnings per share compounded at 9.3% over the past decade, more than twice the 4.1% growth rate from 2005 to 2015. U.S. corporations were able to save more—generate more profits—because the U.S. government increased its dissaving.
Population growth and productivity gains have also supported corporate profits as the overall economy has expanded. Still, the increase in the federal budget deficit, both in absolute terms and as a share of economic output, has contributed meaningfully to above-average earnings-per-share growth.
Will this deficit-induced profit boom reverse? Not in the near-term. U.S. elected officials have shown little inclination to reduce the federal budget deficit, as evidenced by the passage of the One Big Beautiful Bill Act. Much of the associated tax relief will take effect in 2026, providing additional stimulus to the U.S. economy.
While the U.S. budget deficit-to-GDP remains elevated at 5.9%, non-U.S. budget deficits as a percentage of GDP have declined following their pandemic-era expansion. For example, Europe’s budget deficit-to-GDP ratio is 3.1%, while Japan’s is at 4.6%. That puts other nations on a more sustainable fiscal path compared to the U.S.
Ultimately, the U.S. is unlikely to shrink its budget deficit meaningfully unless forced to by the bond market if bond investors demand a higher term premium—additional yield compensation for fiscal uncertainty.
Not only does the U.S. fiscal situation increase U.S. stock risk, but so do high stock valuations. While U.S. stock valuations have come down from five years ago when earnings troughed, they remain expensive relative to long-term averages—and relative to non-U.S. stocks, as reflected in higher forward P/E ratios.

Due to those valuation differences, the margin of safety for U.S. stocks is less than for non-U.S. stocks.
Meanwhile, geopolitical risks have increased. A U.S. military operation in Venezuela resulted in the capture of President Nicolás Maduro, drawing criticism from governments and international organizations and raising concerns about regional stability. At the same time, renewed statements by U.S. officials about acquiring Greenland, despite strong opposition from Denmark and NATO allies, have heightened uncertainty about the direction of U.S. foreign policy.
Economic Trends
An AI-driven investment boom contributed to corporate profit growth and economic activity in 2025. The scale of the investment is extraordinary, with some estimates suggesting cumulative spending of up to $5 trillion over the next five years.
2026 will be a critical year for assessing whether this investment translates into higher productivity, boosting economic growth. To date, evidence of broad-based productivity gains remains largely anecdotal. While U.S. employment growth has slowed, much of that appears to reflect corporate caution amid overlapping uncertainties, including tariffs, immigration policy, and the pace and direction of AI adoption.
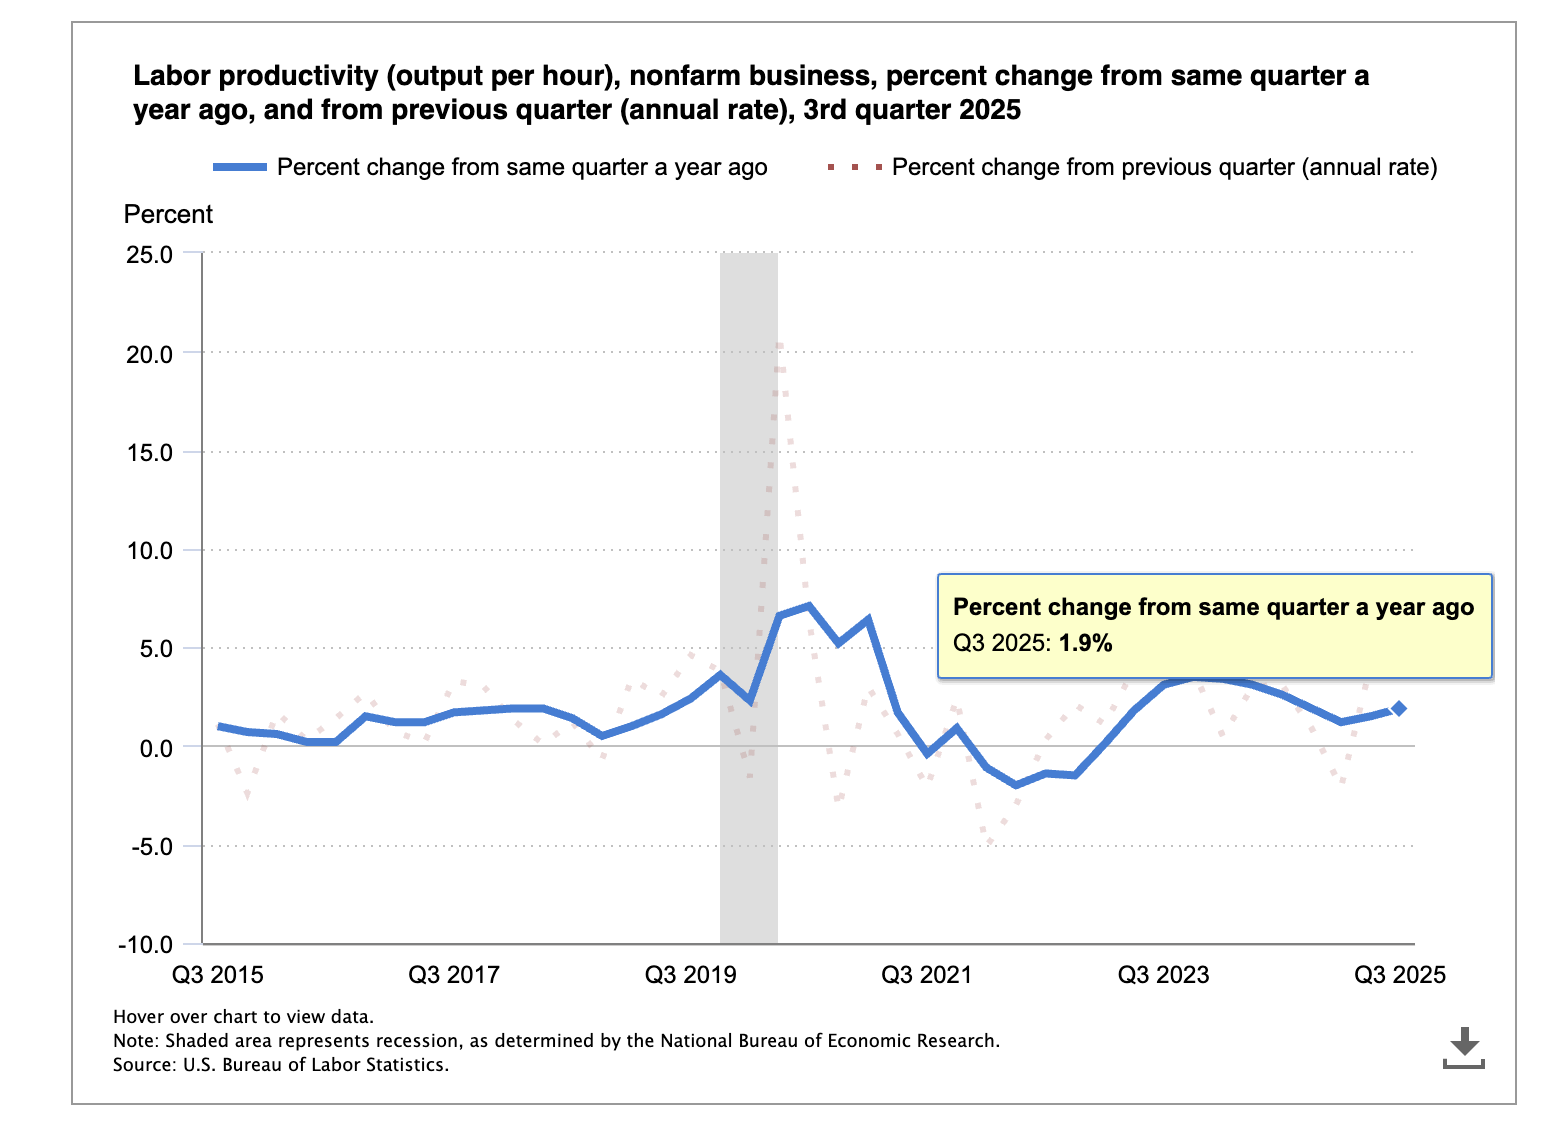
While third-quarter 2025 U.S. productivity rebounded sharply, with labor output per hour rising to a near-term high on a quarterly basis, year-over-year productivity grew only a modest 1.9%. It is possible the jump in productivity in the third quarter is linked to AI implementation, but the official data do not yet isolate technology as a clear driver.
For AI to deliver a meaningful and lasting productivity boost, it will need to do more than improve efficiency in existing tasks such as writing, coding, or summarization. It will need to become significantly more energy efficient and, more importantly, serve as a catalyst for genuine innovation rather than incremental refinement.
Leading Economic Indicators
The macroeconomic environment slowed toward the end of 2025, but leading economic indicators remain in expansion territory, consistent with global economic growth of about 3%.


Manufacturing PMIs

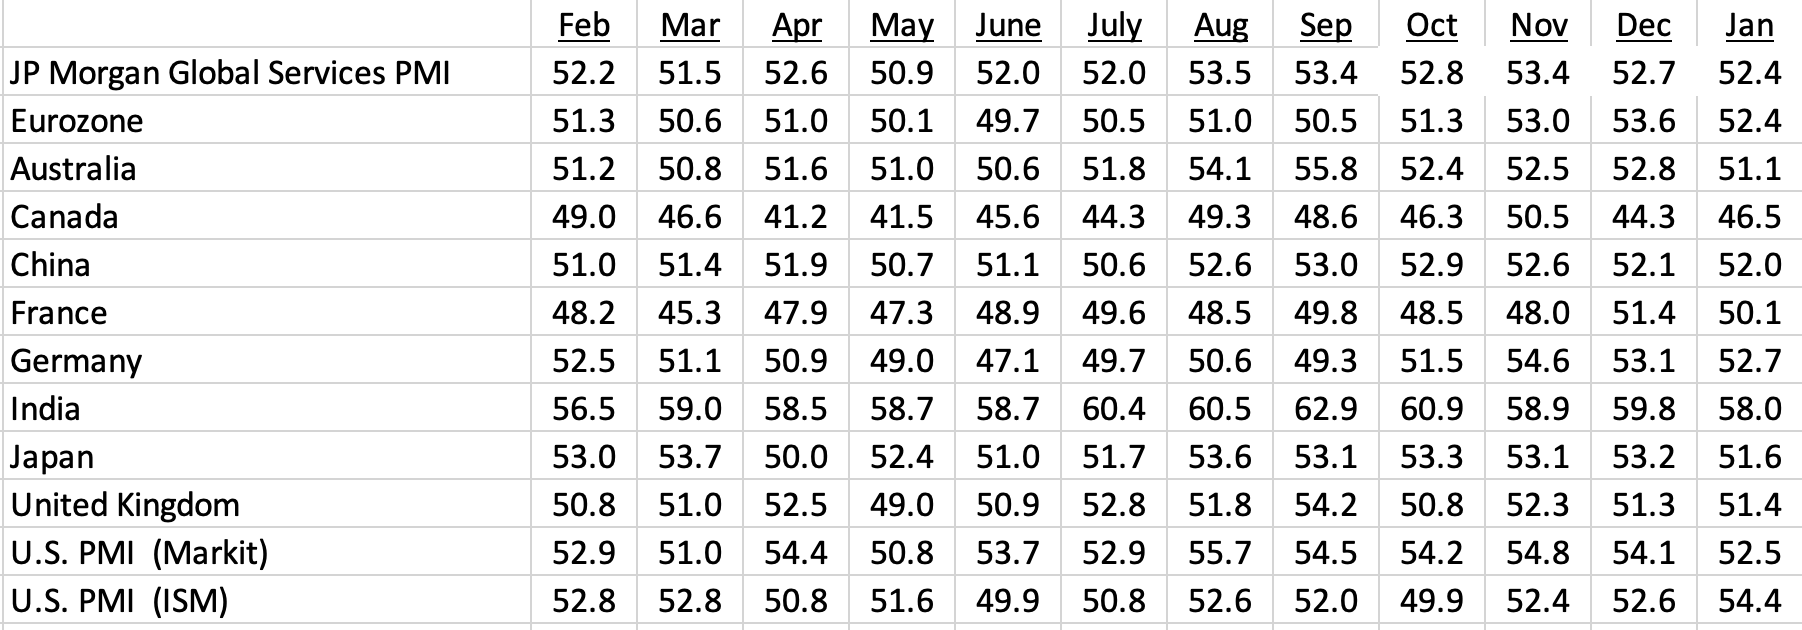
Services PMIs
The OECD projects global GDP to increase by 2.9% in 2026, with emerging markets, including India, China, and Indonesia, posting the highest growth rates.

Where Are We Heading
Leading economic indicators, corporate profit trends, ongoing government stimulus, and continued AI investment and implementation all point to 2026 being another solid year for stocks and other risk assets.
Most of the foreseeable risks are political and judicial in nature. The U.S. Supreme Court is expected to rule in the coming weeks on the legality of the Trump Administration’s tariffs and its attempted removal of a Federal Reserve Board governor.
A new Federal Reserve Board Chair will take office in May 2026, raising questions about how supportive future leadership will be of additional reductions in the federal funds rate.
Geopolitical risks also remain elevated. The war in Ukraine continues without resolution, China remains increasingly assertive toward Taiwan, tensions persist in the Middle East, and the U.S. has signaled a greater willingness to take an active military role in Latin America.
If the current status quo holds, these geopolitical hotspots are unlikely to materially disrupt global economic growth. The primary risk lies in a significant escalation that could sharply increase market volatility, disrupt global trade flows, and undermine business and consumer confidence.
Portfolio Positioning
Global financial markets have delivered strong returns in 2025, supported by accelerating earnings growth, falling interest rates, and an unprecedented wave of AI-related capital spending.
Economic tailwinds remain in place, so despite three-years of double-digit stock returns and higher valuations, a reasonable base case is that risk assets will perform well in 2026, barring a major geopolitical disruption.
Our positioning recommendations are unchanged:
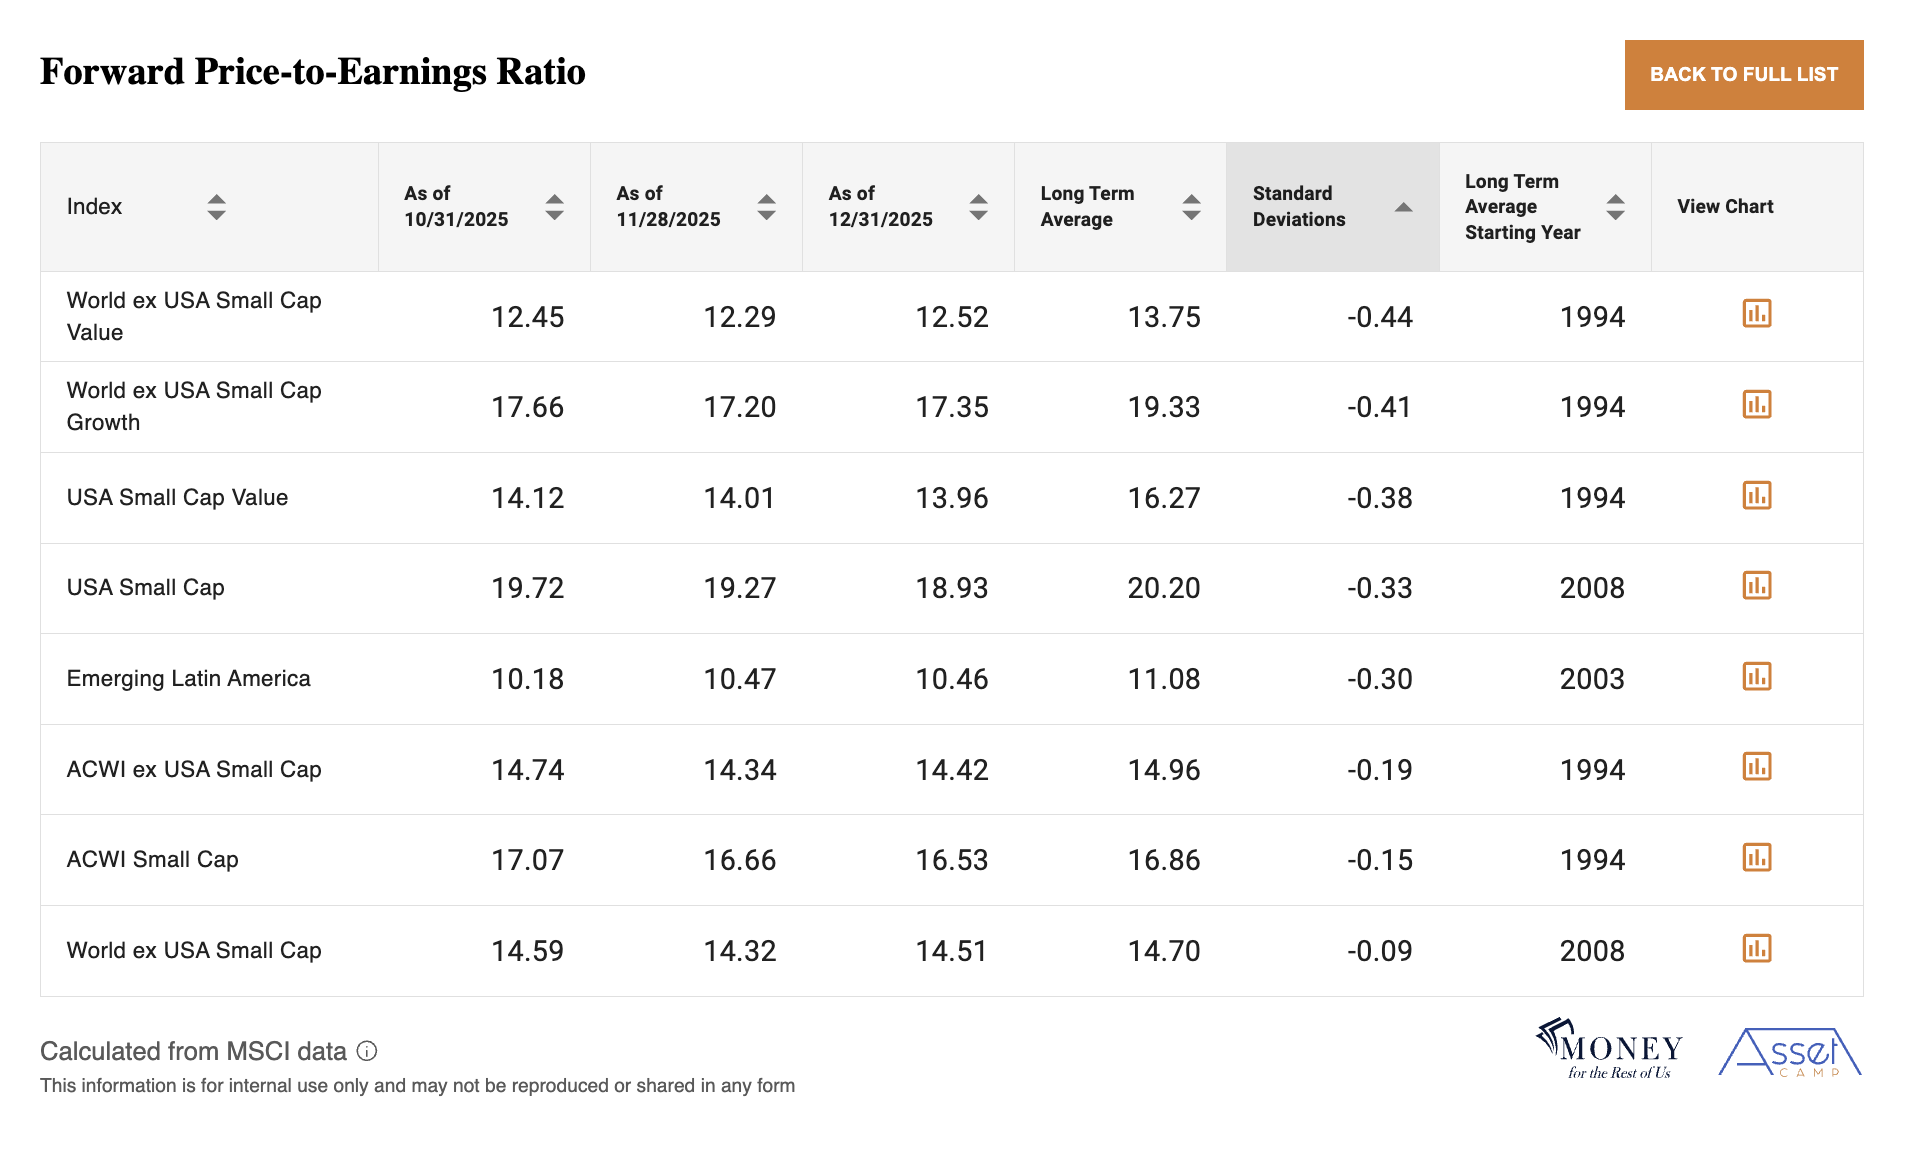
U.S. large-cap stocks remain expensive relative to history, supporting an underweight stance. Non-U.S. equities, including small caps, continue to offer more attractive valuations and provide a way to participate in potential productivity gains from AI without paying the highest multiples.
This table shows the least expensive stock markets around the world based on what investors are paying for expected earnings relative to the long-term average.
Within fixed income, short-duration assets still provide positive real yields. Bullet ETFs and individual bonds, including Treasury Inflation-Protected Securities, allow investors to lock in current yields and benefit from potential price appreciation if interest rates decline. Credit markets offer appealing nominal yields, but the dispersion across sectors suggests a selective approach. Higher-rated collateralized loan obligations remain one of the more resilient ways to access credit risk.
Long-duration bonds remain vulnerable to increases in term premiums, especially if fiscal concerns or ongoing policy uncertainty become a more prominent narrative in 2026.
Conclusion
The global investment backdrop entering 2026 has supportive economic fundamentals, even as political and geopolitical risks have risen.
Earnings growth, fiscal stimulus, easing financial conditions, and continued capital investment—particularly related to AI—provide a solid foundation for continued economic expansion and positive financial returns.
At the same time, elevated valuations in U.S. equities and the growing importance of policy and geopolitical outcomes argue for diversification rather than concentration. In this environment, successful investing is less about forecasting specific events and more about maintaining exposure to growth while preserving a margin of safety.
A globally diversified portfolio, disciplined valuation awareness, and a selective approach to risk can help navigate a year in which fundamentals are constructive, but outcomes may be shaped at the margins by forces outside the economy itself.
Investment Conditions Summary

