This is the March 2021 investment conditions and strategy report. It includes both a written version and an audio commentary that is part of Plus Episode 333.
Executive Summary
- Global stock markets gained in February despite the headwinds from higher interest rates. Global bonds declined.
- The value style has significantly outperformed the growth style year-to-date, after years of value underperformance.
- The increase in interest rates is not unexpected given the economic recovery and level of stimulus as inflation expectations rise and investors seek additional yield compensation for unexpected inflation.
- The risk is interest rates spike because market participants lose faith in central banks’ ability to keep inflation in check. That could negatively impact the economic recovery and the stock market.
- For now, interest rates are well below the levels that could impede economic growth.
- Economic indicators and corporate earnings growth continue to improve, suggesting that asset class valuations will come down from lofty levels.
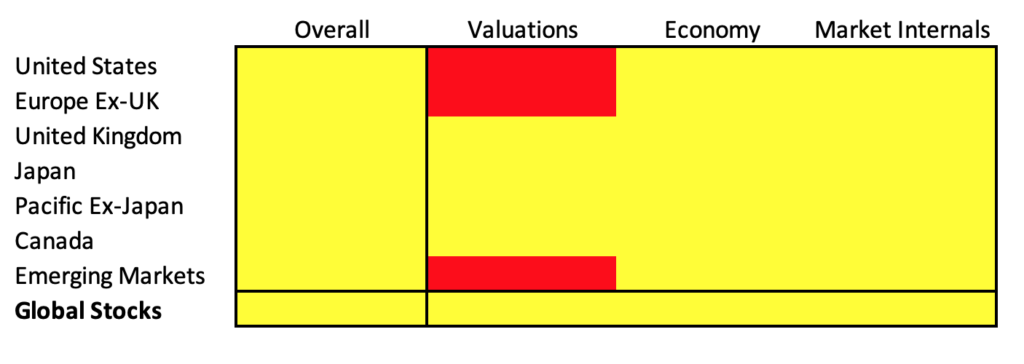
- With valuations RED and economic trends and market internals high neutral, overall investment conditions are YELLOW, suggesting that investors can feel comfortable keeping their asset allocation close to their long-term target.
- Investors putting new money to work should dollar cost average in order to manage regret if markets sell-off due to missed expectations or some other economic or geopolitical shock.
Purpose of the Investment Conditions and Strategy Report
The purpose of this monthly report is to provide you an objective and concise review of investment conditions.
Understanding investment conditions can help you make portfolio allocation decisions such as increasing exposure to asset classes and regions that are more attractive or reducing exposure to asset classes and regions that are more expensive and where risks are increasing. The report can help you decide when and how to rebalance, whether to dollar cost average, or invest a lump sum all at once.
A periodic review of investment conditions can also give you the confidence and peace of mind to stick to your current allocation by filtering out much of the financial noise so you can focus on where markets stand today relative to their history.
Monitoring investment conditions is helpful for scaling exposure to risky assets such as stocks and non-investment grade bonds as favorable investment conditions generally align with positive investment returns while unfavorable investment conditions have generally been associated with sub-par investment returns.
In this report, investment conditions are segmented into three areas:
- Market valuations – measure how expensive or cheap the global stock market, bonds, and other asset classes are.
- Economic and central bank trends – measure the anticipated direction of the economy based on purchasing managers indices (“PMI”), other leading economic indicators, and how accommodating central banks are with regards to their interest rate policies.
- Market internals – measure market trends and momentum and the level of fear and greed exhibited by investors.
Market valuations, market internals, and economic and central bank trends are rated red for bearish, green for bullish, and yellow for neutral.
When they are red, as they were in early 2008 and 2020, that warrants caution and a more conservative investment approach.
When they are green as they were in mid-2009 coming out of the Great Financial Crisis, then that provides an opportunity to increase portfolio risk and generate higher returns.
By design, the metrics covered in this report are streamlined to focus on the most relevant data for navigating an uncertain world. Having more data does not necessarily lead to better investment decisions. Rather, this report focuses on building blocks that influence future returns for asset classes such as:
- Current dividend yields, earnings yields, and interest rate yields relative to historical trends. Higher yields equate to higher future returns.
- How investors are valuing cash flows and earnings. When investors place a low value on earnings and cash flows, such as when earnings yields and dividend yields are high and price-to-earnings ratios low, then that can lead to higher future returns.
- Whether the risk of a recession is increasing or decreasing, as measured by PMI and other leading economic indicators. Economic trends impact corporate profits, financial stress, and investor expectations.
- Whether central bank actions are putting upward pressure or downward pressure on interest rates, which can lead to changes in asset class valuations and investor expectations.
- How broad or narrow is the prevailing market trends in terms of the percentage of stocks and stock markets in an uptrend or downtrend? A healthy market is denoted by broad participation with investors neither overly fearful or overly zealous. An unhealthy market has divergences or movements opposite the existing trend that can be a sign of mounting risks that may warrant adjusting exposures.
Historical Investment Conditions
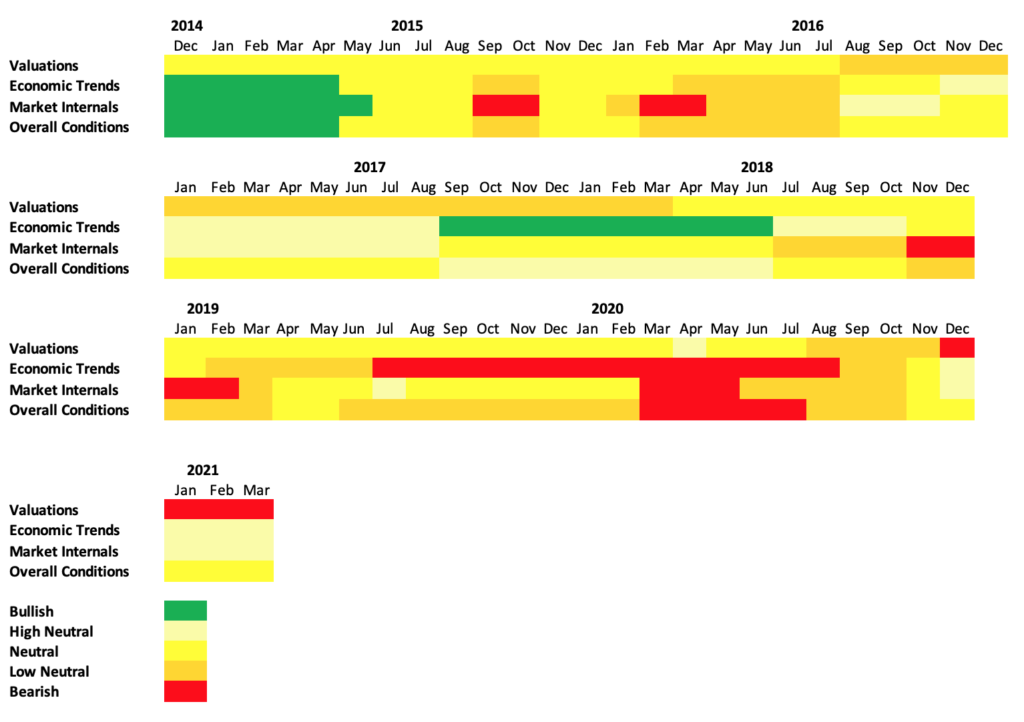
Overall Global Investment Conditions Are YELLOW

As of early March 2021, overall investment conditions are neutral YELLOW.
Global stock markets gained in February despite the headwinds from higher interest rates.
Growth versus Value
The value style has significantly outperformed the growth style year-to-date, after years of value underperformance.
A steeper yield curve with short-term interest rates remaining low while longer-term interest rates increase is positive for financial stocks, which make up a meaningful weight of value indices. A steeper yield curve boosts financial companies’ profitability due to higher net interest margins. The net interest margin is the spread between a financial institution’s average loan rate and its average deposit rate.
In addition, a rise in rates due to improving economic growth prospects tends to favor more cyclical sectors that also comprise larger weights in value indices.
Finally, growth stocks with their higher earnings growth rates have a larger percentage of their expected future earnings growth farther out in time. Consequently, growth stocks are more sensitive to rising interest rates. Growth stocks’ intrinsic values as measured by the present value of future earnings fall more than value stocks as interest rates increase. In bond market vernacular, growth stocks have longer durations than value stocks.
Rising Interest Rates
A normalization of interest rates with longer-term rates rising is not unexpected.
10 Year Treasury yields bottomed in August 2020 at 0.5% and have now increased by 1% point. They remain nearly 0.5% below where rates started 2020 and 1.5% point below where 10 Year Treasury yields were in the Fall of 2018.
Given the Federal Reserve’s commitment to keep its policy rate near zero for many months, a further rise in U.S. interest rates would need to come from higher expected inflation or from a higher term premium that compensates investors for unexpected inflation or unexpected actions by the central bank.
As it stands now, the term premium and the expected inflation rate are close to where they were when interest rates last peaked in October 2018 when the 10 Year Treasury yield hit 3.2%. Nominal rates are much lower today because real interest rates are negative. A primary driver of real yields is the expected path of future short-term interest rates. With the Federal Reserve indicating they don’t expect to increase its policy rate for several years, real yields are likely to remain low.
Of course, the risk is interest rates move higher than what would be considered normal if market participants lose faith in the Federal Reserve’s ability to keep inflation in check, particularly if inflation exceeds 3% for an extended period of time.
Such a rate increase would come from both higher expected inflation and higher term premiums.
If interest rates get too high, that could start to impede the economic recovery as household and businesses’ debt service costs would increase and their willingness to borrow would lessen. That, in turn, could impact the stock market recovery and lead to higher credit spreads as investors want additional compensation to protect against default risk.
Interest rates are well below the levels that could impact economic growth, but we will monitor leading economic indicators and corporate bond spreads to see if the economic recovery is threatened.
Current Conditions
Meanwhile, the global economy and corporate earnings are rebounding. Asset class valuations are high with some countries, such as the U.S., very expensive.
Earnings expectations are elevated with global earnings growth anticipated to grow close to 25% in the next year. (See the earning growth table, a new addition to the report, under the Asset Class Valuations section).
The Conference Board’s CEO Confidence index reached its highest level since 2004. High confidence by corporate leaders has tended to coincide with strong profit growth.
Valuations can stay expensive for a long time especially during periods when economic growth and earnings are improving. That is why the investment conditions report focuses not just on valuations but on economic trends and market internals.
With valuations RED and economic trends and market internals high neutral, overall investment conditions are YELLOW, suggesting that investors can feel comfortable keeping their asset allocation close to their long-term target.
Investors putting new money to work should dollar cost average in order to manage regret if markets sell-off due to missed expectations or some other economic or geopolitical shock.
Despite the high valuations for stocks, equities will more than likely outperform bonds over the next five to ten years given the low level of interest rates, but investors will need to be patient and ready themselves for some volatile periods.
Market Returns
Global stocks gained 2.3% in February. Emerging markets have outperformed developed markets year-to-date while value strategies have outperformed growth and momentum-oriented strategies.
The following table provides an overview of equity market returns:
Global Stock Market Returns For the Periods Ending February 28, 2021
| Feb (USD) | YTD (USD) | Feb (LOCAL) | YTD (LOCAL) | |
|---|---|---|---|---|
| ACWI All Country World Index | 2.3% | 1.9% | 2.4% | 2.3% |
| AC Americas | 2.6% | 1.5% | 2.6% | 1.6% |
| U.S.A | 2.6% | 1.6% | 2.6% | 1.6% |
| Canada | 5.6% | 4.4% | 4.6% | 3.8% |
| AC Asia | 1.3% | 3.6% | 2.1% | 5.1% |
| AC Asia Pacific Ex-Japan | 1.4% | 4.9% | 1.4% | 5.3% |
| Japan | 1.5% | 0.5% | 3.3% | 3.7% |
| Australia | 2.6% | 2.7% | 1.7% | 2.3% |
| AC Europe | 2.4% | 0.9% | 2.3% | 1.3% |
| France | 5.0% | 1.7% | 5.1% | 2.6% |
| Germany | 2.0% | 0.1% | 2.1% | 1.0% |
| Switzerland | -2.3% | -4.3% | -0.6% | -2.0% |
| United Kingdom | 3.6% | 3.4% | 1.8% | 1.0% |
| Emerging Markets | 0.8% | 3.9% | 1.0% | 4.9% |
| Emerging Latin America | -3.0% | -9.5% | -1.1% | -4.1% |
| Emerging Asia | 0.9% | 5.3% | 1.1% | 5.9% |
| Emerging Europe & Middle East | 1.5% | 1.9% | 1.3% | 2.1% |
Source: MSCI
Bond Market and Income Strategy Returns
Global bonds declined in February and are in negative territory year-to-date as interest rates increased in anticipation of the economic recovery coupled with additional fiscal stimulus in the U.S.
Fixed Income Returns For the Periods Ending February 28, 2021
| Unhedged Index | Feb (USD) | YTD (USD) |
|---|---|---|
| Multiverse | -1.7% | -2.5% |
| Global Aggregate | -1.7% | -2.6% |
| Global High-Yield | 0.1% | 0.0% |
| U.S. Aggregate | -1.4% | -2.2% |
| U.S. Corporate High-Yield | 0.4% | 0.7% |
| S&P/LSTA U.S. Leveraged Loan 100 Index | 0.3% | 1.3% |
| U.S. Municipal | -1.6% | -1.0% |
| Emerging Markets USD | -1.4% | -2.3% |
| Emerging Markets Local Govt | -1.5% | -1.9% |
| Feb (EUR) | YTD (EUR) | |
| Pan European Aggregate | -1.9% | -2.3% |
| Euro Aggregate | -1.6% | -2.0% |
| Feb (GBP) | YTD (GBP) | |
| Sterling Aggregate | -5.1% | -6.6% |
| Feb (JPY) | YTD (JPY) | |
| Asian Pacific Aggregate | -0.2% | 0.4% |
Source: Bloomberg
For income strategies, REITs and MLPs were positive in February while preferred stocks declined. Commodities gained over 10% for the month.
Income Strategies and Commodity Returns for Periods Ending February 28, 2021
| Feb (USD) | YTD (USD) | |
|---|---|---|
| Down Jones Equity All REIT Index | 2.7% | 2.7% |
| S&P Global REIT Index | 3.0% | 2.8% |
| S&P U.S. Preferred Stock Index | -1.0% | -1.9% |
| Alerian MLP Index Total Return Index | 7.8% | 14.1% |
| S&P GSCI Commodity Index | 10.6% | 16.1% |
Source: Alerian and S&P Dow Jones
Asset Class Valuations – RED

Global stock market valuations are rated RED.
Valuations for equity regions and sectors are unfavorable, using both historical measures and forward looking measures.
The cyclically-adjusted price-to-earnings ratio for the MSCI All Country World Index fell slightly to 25.1 but remains close to its highest level since 2008.
A significant earnings rebound is required in 2021 to justify the expensive valuations for global stocks. The earnings yield based on expected earnings is the lowest it has been on record, reinforcing the high earnings expectations priced into stocks. The lower the earnings yield, the more expensive the valuation. (See the forward earning yield tables below, a new edition to the report).
Analysts expect global stock market earnings to increase by 25% in 2021 after falling 20% in the past year. U.S. corporate earnings are expected to increase by 20% in 2021, while non-U.S. stocks, including emerging markets, are expected to grow earnings by 30% over the next twelve months.
If companies fall short of these lofty earnings expectations, that could leave the stock market vulnerable to a sell-off, particularly if longer-term interest rates rise.
Fortunately, fourth-quarter earnings releases show the vast majority of companies worldwide have exceeded earnings estimates and revised earnings upward.
A high rate of positive earnings revision has been a precursor to strong earnings growth.
An earnings rebound will lead to improved valuations both on a trailing 12-month earnings basis as well as for cyclically-adjusted valuation measures that use average earnings over the past decade.
Low yields on government bonds can partially justify above-average valuations for risk assets, as earnings yields remain above bond yields. If interest rates rise too quickly, that could put downward pressure on stocks if earnings don’t come through.
Global Equity Markets Earnings Yields as of March 1, 2021
| Jan Earnings Yield | Feb Earnings Yield | Mar Earnings Yield | Historical Average Earnings Yield | Historical Average Starting Year | Standard Deviations From Average | Favorable or Unfavorable Versus Average | |
|---|---|---|---|---|---|---|---|
| All Country World | 3.7% | 3.6% | 3.6% | 5.2% | 1995 | 1.3 | Unfavorable |
| World (Developed) | 3.5% | 3.5% | 3.5% | 6.3% | 1970 | 1.3 | Unfavorable |
| World ex U.S. | 4.3% | 4.3% | 4.2% | 6.4% | 1970 | 0.9 | Unfavorable |
| Developed Asia | 4.1% | 4.0% | 4.1% | 4.3% | 1973 | 0.2 | Unfavorable |
| Asia Pacific ex. Japan | 4.5% | 4.1% | 4.1% | 6.5% | 1995 | 1.5 | Unfavorable |
| Japan | 4.1% | 3.9% | 4.2% | 4.0% | 1969 | 0.1 | Favorable |
| Europe | 4.5% | 4.5% | 4.3% | 7.5% | 1969 | 1.1 | Unfavorable |
| Europe ex. UK | 4.1% | 4.2% | 3.9% | 6.8% | 1974 | 1.2 | Unfavorable |
| U.K. | 5.7% | 5.6% | 5.4% | 8.5% | 1969 | 0.4 | Unfavorable |
| Emerging Markets | 4.5% | 4.2% | 4.3% | 6.9% | 1995 | 1.9 | Unfavorable |
| Emerging Asia | 4.5% | 4.1% | 4.2% | 6.2% | 1995 | 1.0 | Unfavorable |
| Emerging Europe | 5.9% | 6.1% | 6.3% | 10.1% | 1996 | 0.9 | Unfavorable |
| Emerging Latin America | 4.0% | 3.9% | 4.2% | 6.9% | 1995 | 1.8 | Unfavorable |
| Frontier Markets | 6.8% | 6.7% | 6.8% | 8.2% | 2008 | 0.7 | Unfavorable |
| Australia | 4.0% | 3.9% | 3.7% | 6.9% | 1970 | 1.5 | Unfavorable |
| Canada | 4.1% | 4.1% | 4.0% | 6.3% | 1969 | 0.8 | Unfavorable |
| China | 5.0% | 4.4% | 4.6% | 7.3% | 1995 | 1.3 | Unfavorable |
| France | 3.1% | 3.1% | 2.7% | 6.6% | 1971 | 1.1 | Unfavorable |
| Germany | 4.1% | 4.1% | 4.0% | 6.8% | 1969 | 1.1 | Unfavorable |
| India | 2.5% | 5.7% | 1995 | 1.1 | |||
| Switzerland | 4.6% | 4.6% | 4.7% | 6.8% | 1969 | 0.7 | Unfavorable |
| U.S. | 3.1% | 3.0% | 3.1% | 6.8% | 1969 | 1.4 | Unfavorable |
Source: Ned Davis Research and MSCI
Note: The earnings yield figures are based on trailing twelve-month earnings. Earnings yield is the inverse of the price-to-earnings ratio. The lower the earnings yield, the more expensive the valuation. Standard deviation measures how far outside of the norm the earnings yield is. The higher the standard deviation the further the current measure is from the average. Standard deviations listed in red denote a market that is more expensive than average while those in black are at their average or cheaper than average.
Global Equity Markets Forward Earnings Yields as of March 1, 2021
| Mar Earnings Yield | Historical Average Earnings Yield | Historical Average Starting Year | Standard Deviations From Average | Favorable or Unfavorable Versus Average | |
|---|---|---|---|---|---|
| All Country World | 5.2% | 7.2% | 2003 | 1.9 | Unfavorable |
| World (Developed) | 5.0% | 7.0% | 2003 | 1.8 | Unfavorable |
| World ex U.S. | 5.9% | 7.5% | 2003 | 1.3 | Unfavorable |
| Developed Asia | 5.6% | 6.7% | 2003 | 1.2 | Unfavorable |
| Asia Pacific ex. Japan | 5.7% | 8.0% | 2003 | 1.1 | Unfavorable |
| Japan | 5.6% | 6.8% | 2003 | 0.9 | Unfavorable |
| Europe | 6.0% | 7.9% | 2003 | 1.3 | Unfavorable |
| Europe ex. UK | 5.6% | 7.9% | 2003 | 1.4 | Unfavorable |
| U.K. | 7.1% | 8.0% | 2003 | 0.5 | Unfavorable |
| Emerging Markets | 6.4% | 9.0% | 2003 | 1.0 | Unfavorable |
| Emerging Asia | 5.8% | 8.7% | 2003 | 2.1 | Unfavorable |
| Emerging Europe | 11.5% | 13.3% | 2003 | 0.5 | Unfavorable |
| Emerging Latin America | 8.8% | 8.8% | 2003 | 0.0 | Same |
| Australia | 5.4% | 7.1% | 2003 | 0.7 | Unfavorable |
| Canada | 6.1% | 7.1% | 2003 | 0.4 | Unfavorable |
| China | 5.8% | 8.9% | 2003 | 1.5 | Unfavorable |
| France | 5.6% | 8.0% | 2003 | 1.5 | Unfavorable |
| Germany | 6.4% | 8.3% | 2003 | 1.4 | Unfavorable |
| India | 4.3% | 6.4% | 2003 | 1.7 | Unfavorable |
| Switzerland | 5.6% | 6.9% | 2003 | 1.3 | Unfavorable |
| U.S. | 4.5% | 6.7% | 2003 | 1.9 | Unfavorable |
Source: Ned Davis Research and MSCI
Global Equity Markets Dividend Yields as of March 1, 2021
| Jan Dividend Yield | Feb Dividend Yield | Mar Dividend Yield | Historical Average Earnings Yield | Historical Average Starting Year | Standard Deviations From Average | Favorable or Unfavorable Versus Average | |
|---|---|---|---|---|---|---|---|
| All Country World | 1.8% | 1.8% | 1.8% | 2.2% | 1995 | 1.0 | Unfavorable |
| World (Developed) | 1.8% | 1.7% | 1.8% | 2.9% | 1970 | 1.2 | Unfavorable |
| World ex U.S. | 2.4% | 2.4% | 2.4% | 3.0% | 1970 | 0.6 | Unfavorable |
| Asia | 2.3% | 2.2% | 2.2% | 1.9% | 1973 | 0.4 | Favorable |
| Asia Pacific ex. Japan | 1.9% | 1.8% | 1.8% | 2.9% | 1995 | 1.8 | Unfavorable |
| Japan | 2.0% | 1.9% | 1.9% | 1.7% | 1969 | 0.5 | Favorable |
| Europe | 2.4% | 2.4% | 2.4% | 3.8% | 1969 | 1.2 | Unfavorable |
| Europe ex. UK | 2.2% | 2.1% | 2.1% | 3.6% | 1974 | 1.3 | Unfavorable |
| U.K. | 3.3% | 3.3% | 3.1% | 4.2% | 1969 | 0.5 | Unfavorable |
| Emerging Markets | 1.9% | 1.8% | 1.8% | 2.5% | 1995 | 1.4 | Unfavorable |
| Emerging Asia | 1.7% | 1.5% | 1.5% | 2.1% | 1995 | 1.1 | Unfavorable |
| Emerging Europe | 3.9% | 4.0% | 4.0% | 2.6% | 1996 | 1.0 | Favorable |
| Emerging Latin America | 2.6% | 2.5% | 2.4% | 3.0% | 1995 | 1.0 | Unfavorable |
| Frontier Markets | 3.6% | 3.5% | 3.6% | 4.2% | 2008 | 0.9 | Unfavorable |
| Australia | 2.7% | 2.7% | 2.7% | 4.1% | 1970 | 1.4 | Unfavorable |
| Canada | 3.0% | 3.0% | 2.9% | 3.0% | 1969 | 0.1 | Unfavorable |
| China | 1.4% | 1.2% | 1.2% | 2.5% | 1995 | 1.6 | Unfavorable |
| France | 1.9% | 1.9% | 1.8% | 3.9% | 1971 | 1.2 | Unfavorable |
| Germany | 2.5% | 2.4% | 2.4% | 3.4% | 1969 | 0.8 | Unfavorable |
| India | 0.9% | 1.4% | 1995 | 1.5 | Unfavorable | ||
| Switzerland | 2.8% | 2.8% | 2.9% | 2.4% | 1969 | 0.6 | Favorable |
| U.S. | 1.5% | 1.4% | 1.5% | 3.0% | 1969 | 1.2 | Unfavorable |
Source: Ned Davis Research and MSCI
Note: The dividend yield figures are based on trailing twelve-month dividends. Standard deviation measures how far outside of the norm the dividend yield is. The higher the standard deviation the further the current measure is from the average. Standard deviations listed in red denote a market with a dividend yield lower than average while those in black are markets with dividend yields that are at their average or higher than average.
Global Sectors Earnings Yield as of March 1, 2021
| Jan Earnings Yield | Feb Earnings Yield | Mar Earnings Yield | Historical Average Earnings Yield | Historical Average Starting Year | Standard Deviations From Average | Favorable or Unfavorable Versus Average | |
|---|---|---|---|---|---|---|---|
| Energy | 0.6% | 0.3% | 0.0% | 6.8% | 1995 | 2.3 | Unfavorable |
| Materials | 3.6% | 3.7% | 3.7% | 5.8% | 1995 | 1.1 | Unfavorable |
| Industrials | 2.9% | 2.9% | 2.8% | 5.1% | 1995 | 1.5 | Unfavorable |
| Consumer Discretionary | 2.2% | 2.2% | 2.3% | 4.8% | 1995 | 1.8 | Unfavorable |
| Consumer Staples | 4.6% | 4.7% | 4.9% | 4.9% | 1995 | 0.0 | Same |
| Health Care | 3.7% | 3.6% | 3.8% | 4.6% | 1995 | 0.7 | Unfavorable |
| Financials | 7.1% | 7.2% | 6.7% | 6.4% | 1995 | 0.3 | Favorable |
| Information Technology | 2.7% | 2.7% | 2.8% | 4.0% | 1995 | 0.6 | Unfavorable |
| Communication Services | 3.4% | 3.3% | 3.3% | 5.3% | 1995 | 1.0 | Unfavorable |
| Utilities | 6.0% | 6.1% | 6.2% | 6.2% | 1995 | 0.0 | Same |
| Real Estate | 4.1% | 4.2% | 4.0% | 5.4% | 2016 | 2.4 | Unfavorable |
Source: Ned Davis Research and MSCI
Global Sectors Forward Earnings Yield as of March 1, 2021
| Mar Earnings Yield | Historical Average Earnings Yield | Historical Average Starting Year | Standard Deviations From Average | Favorable or Unfavorable Versus Average | |
|---|---|---|---|---|---|
| Energy | 5.9% | 8.1% | 2003 | 1.0 | Unfavorable |
| Materials | 6.8% | 7.8% | 2003 | 0.5 | Unfavorable |
| Industrials | 4.6% | 6.8% | 2003 | 1.9 | Unfavorable |
| Consumer Discretionary | 3.8% | 6.4% | 2003 | 2.0 | Unfavorable |
| Consumer Staples | 5.3% | 5.9% | 2003 | 0.8 | Unfavorable |
| Health Care | 5.7% | 6.7% | 2003 | 0.8 | Unfavorable |
| Financials | 8.2% | 8.8% | 2003 | 0.5 | Unfavorable |
| Information Technology | 3.8% | 6.2% | 2003 | 1.8 | Unfavorable |
| Communication Services | 4.4% | 7.0% | 2003 | 1.5 | Unfavorable |
| Utilities | 6.5% | 7.1% | 2003 | 0.8 | Unfavorable |
| Real Estate | 4.9% | 5.0% | 2016 | 0.1 | Unfavorable |
Source: Ned Davis Research and MSCI
Global Sectors Dividend Yields as of March 1, 2021
| Jan Dividend Yield | Feb Dividend Yield | Mar Dividend Yield | Historical Average Earnings Yield | Historical Average Starting Year | Standard Deviations From Average | Favorable or Unfavorable Versus Average | |
|---|---|---|---|---|---|---|---|
| Energy | 5.5% | 5.3% | 4.6% | 3.1% | 1995 | 1.6 | Favorable |
| Materials | 2.3% | 2.4% | 2.4% | 2.6% | 1995 | 0.3 | Unfavorable |
| Industrials | 1.6% | 1.6% | 1.5% | 2.1% | 1995 | 1.1 | Unfavorable |
| Consumer Discretionary | 0.7% | 0.7% | 0.7% | 1.6% | 1995 | 2.2 | Unfavorable |
| Consumer Staples | 2.6% | 2.6% | 2.7% | 2.4% | 1995 | 0.7 | Favorable |
| Health Care | 1.7% | 1.7% | 1.7% | 1.9% | 1995 | 0.3 | Unfavorable |
| Financials | 2.7% | 2.8% | 2.6% | 2.9% | 1995 | 0.3 | Unfavorable |
| Information Technology | 1.0% | 1.0% | 1.0% | 1.1% | 1995 | 0.1 | Unfavorable |
| Communication Services | 1.3% | 1.3% | 1.2% | 3.4% | 1995 | 1.7 | Unfavorable |
| Utilities | 3.4% | 3.4% | 3.7% | 3.8% | 1995 | 0.3 | Unfavorable |
| Real Estate | 3.3% | 3.3% | 3.2% | 3.5% | 2016 | 1.4 | Unfavorable |
Source: Ned Davis Research and MSCI
Equity Cyclically-Adjusted Price-to-Earnings Ratios as of March 1, 2021
| Jan Cyclically-Adjusted Price-to-Earnings | Feb Cyclically-Adjusted Price-to-Earnings | Mar Cyclically-Adjusted Price-to-Earnings | Historical Median Price-to-Earnings | Standard Deviation From Median | Favorable or Unfavorable Versus Median | |
|---|---|---|---|---|---|---|
| All Country World | 24.7 | 25.2 | 25.1 | 20.8 | 0.7 | Unfavorable |
| AC Asia Pacific ex. Japan | 18.5 | 19.7 | 19.5 | 17.2 | 0.5 | Unfavorable |
| Pacific ex. Japan | 16.0 | 16.2 | 16.7 | 16.8 | 0.1 | Favorable |
| Japan | 20.4 | 21.0 | 20.9 | 35.8 | 0.7 | Favorable |
| Europe | 18.0 | 17.6 | 18.0 | 16.9 | 0.2 | Unfavorable |
| Europe ex. UK | 20.4 | 20.1 | 20.4 | 18.8 | 0.2 | Unfavorable |
| U.K. | 12.8 | 12.3 | 12.9 | 14.7 | 0.4 | Favorable |
| Emerging Markets | 16.2 | 17.2 | 17.0 | 15.0 | 0.3 | Unfavorable |
| Australia | 16.5 | 16.8 | 17.3 | 16.2 | 0.2 | Unfavorable |
| Canada | 19.3 | 19.2 | 20.0 | 17.9 | 0.2 | Unfavorable |
| China | 18.2 | 20.2 | 19.4 | 16.3 | 0.5 | Unfavorable |
| France | 19.9 | 19.4 | 20.3 | 19.3 | 0.1 | Unfavorable |
| Germany | 17.1 | 17.0 | 17.2 | 17.9 | 0.1 | Favorable |
| India | 27.9 | 22.3 | 0.7 | Unfavorable | ||
| Switzerland | 25.4 | 24.9 | 24.3 | 22.1 | 0.3 | Unfavorable |
| U.S. | 33.2 | 33.9 | 33.4 | 20.8 | 1.5 | Unfavorable |
Source: Ned Davis Research and MSCI
Note: Cyclically-adjusted P/E Ratios also known as Shiller P/E’s are based on the previous 10-year average earnings using MSCI Indices. One important consideration when making valuation judgments using 10-year earnings is whether the previous decade reflects the earnings potential going forward. In other words, are there outliers in the historical earnings record that are not repeatable? Standard deviation measures how far outside of the norm the cyclically-adjusted P/E ratio is. The higher the standard deviation the further the current measure is from the average. Standard deviations listed in red denote a market that is more expensive than its historical average while those in black are markets that are at their average or cheaper than average.
Global Equity Earnings Growth as of March 1, 2021
| 1 Year Trailing Earnings Growth % | 1 Year Forward Earnings Growth % | |
|---|---|---|
| All Country World | -20.1% | 25.3% |
| World (Developed) | -20.6% | 24.1% |
| World ex U.S. | -31.1% | 30.1% |
| Asia | -33.0% | 30.0% |
| Asia Pacific ex. Japan | -36.5% | 23.2% |
| Japan | -31.3% | 33.5% |
| Europe | -36.4% | 27.8% |
| Europe ex. UK | -28.0% | 27.3% |
| U.K. | -33.5% | 38.9% |
| Emerging Markets | -18.4% | 31.9% |
| Australia | -35.2% | 19.4% |
| Canada | -33.7% | 29.3% |
| China | -5.1% | 16.9% |
| France | -51.3% | 47.5% |
| Germany | -20.5% | 35.0% |
| India | -29.1% | 32.8% |
| Switzerland | -4.9% | 12.5% |
| U.S. | -12.6% | 20.4% |
Source: Ned Davis Research and MSCI
Bond and Income Strategy Valuations as of March 1, 2021
The following section reviews the absolute yield and the incremental yield or spreads for bonds and other income-oriented strategies. The comparisons allow you to see whether the spread is higher or lower than its long-term average. An asset category is more attractive when its spread is wider than its long-term average and less attractive when the spread is narrower than its long-term average.
| Jan | Feb | Mar | |
|---|---|---|---|
| Alerian MLP Dividend Yield | 10.4% | 10.0% | 9.3% |
| MLP Incremental Yield Above 10 Year Treasuries | 9.5% | 8.8% | 7.8% |
| 20 Year Median Incremental MLP Yield Over 10-Year Treasuries | 3.6% | 3.6% | 3.6% |
| NAREIT All REIT Dividend Yield (includes mortgage reits) | 3.8% | 3.8% | 3.8% |
| 20 Year All REIT Dividend Yield Average | 5.2% | 5.2% | 5.2% |
| NAREIT Equity REIT Dividend Yield | 3.6% | 3.6% | 3.6% |
| 20 Year Equity REIT Dividend Yield Average | 4.7% | 4.7% | 4.7% |
| Equity REIT Yield Above 10-Year Treasuries | 2.7% | 2.4% | 2.1% |
| 20 Year Average REIT Yield Above 10-Year Treasuries | 1.4% | 1.4% | 1.4% |
| NAREIT Mortgage REIT Dividend Yield | 9.0% | 9.3% | 9.3% |
| 20 Year All REIT Dividend Yield Average | 11.6% | 11.6% | 11.6% |
| Equity REIT Price to Funds from Operations | 20.2 | 20.2 | 21.0 |
| Equity REIT Price to Funds from Operations Long-term Average | 16.3 | 16.3 | 16.3 |
| MLP Incremental Yield Above REIT Yield | 6.6% | 6.1% | 5.4% |
| 20 Year Median Incremental MLP Yield Over REIT Yield | 1.9% | 1.9% | 1.9% |
| U.S. Corporate High Yield Bonds Yield To Worst | 4.2% | 4.3% | 4.2% |
| U.S. High Yield Incremental Yield (i.e., Spread) Above 10 Year Treasuries | 3.3% | 3.2% | 2.8% |
| Average Incremental Yield Since 1983 | 4.9% | 4.9% | 4.9% |
| U.S. Bank Loan (i.e., Leveraged Loan) Yield | 3.9% | 3.8% | 3.7% |
| U.S. Bank Loan Yield Above 3 month Eurodollar Yield | 3.7% | 3.6% | 3.5% |
| Average Incremental Yield Since 2012 | 4.4% | 4.4% | 4.4% |
| U.S. Investment Grade Corporate Bonds Yield To Worst | 1.9% | 1.9% | 2.1% |
| U.S. Investment Grade Incremental Yield (i.e., Spread) Above 10 Year Treasuries | 0.9% | 0.8% | 0.7% |
| Average Incremental Yield Since 1973 | 1.1% | 1.1% | 1.1% |
| U.S. Mortgage-Backed Securities Yield To Worst | 1.3% | 1.2% | 1.8% |
| U.S. MBS Incremental Yield (i.e., Spread) Above 10 Year Treasuries | 0.3% | 0.1% | 0.3% |
| Average Incremental Yield Since 1989 | 0.6% | 0.6% | 0.6% |
| Emerging Market Yields | 3.6% | 3.6% | 3.8% |
| Emerging Market Incremental Yield (i.e., Spread) Above 10 Year Treasuries | 2.7% | 2.5% | 2.3% |
| Average Incremental Yield Since 1997 | 4.1% | 4.1% | 4.1% |
| U.S. Real 5-Year Yield | -1.6% | -1.8% | -1.7% |
| Nominal 5-Year Yield minus Real 5-Year Yield | 2.0% | 2.0% | 2.5% |
| U.S. Real 7-Year Yield | -1.3% | -1.4% | -1.2% |
| Nominal 7-Year Yield minus Real 7-Year Yield | 2.0% | 2.0% | 2.4% |
| U.S. Real 10-Year Yield | -1.0% | -1.0% | -0.7% |
| Nominal 10-Year Yield minus Real 10-Year Yield | 2.1% | 2.1% | 2.2% |
| U.S. 10-Year Treasury Yield | 0.9% | 1.1% | 1.4% |
Source: Ned Davis Research
Economic and Central Bank Trends – YELLOW

The most robust data set for understanding global economic growth trends is Purchasing Manager Indices (PMIs), which are monthly surveys of businesses conducted by Markit and other providers.
There are both Manufacturing and Services PMI surveys conducted each month. Generally, a reading above 50 suggests an economy is expanding while a reading below 50 suggests an economy is contracting.
Manufacturing PMIs are more cyclical and have a longer and more accurate history of predicting global recessions. This report includes data for both manufacturing and services PMIs.
The following table provides an overview of global PMI as well as select regions and countries.
PMI Data As of March 1, 2021
Manufacturing PMI
| Sep | Oct | Nov | Dec | Jan | Feb | Mar | |
|---|---|---|---|---|---|---|---|
| JP Morgan Global PMI | 51.8 | 52.3 | 53.0 | 53.7 | 53.8 | 53.5 | 53.9 |
| Developed Markets | 51.2 | 52.2 | 52.8 | 53.8 | 54.8 | 55.2 | 56.4 |
| Emerging Markets | 52.5 | 52.8 | 53.4 | 53.9 | 52.8 | 52.1 | 51.5 |
| Eurozone | 51.7 | 53.7 | 54.8 | 53.8 | 55.2 | 54.8 | 57.9 |
| Australia | 53.6 | 55.4 | 54.2 | 55.8 | 55.7 | 57.2 | 56.9 |
| Canada | 55.1 | 56.0 | 55.5 | 55.8 | 57.9 | 54.4 | 54.8 |
| China | 53.1 | 53.0 | 53.6 | 54.9 | 53.0 | 51.5 | 50.9 |
| France | 49.8 | 51.2 | 51.3 | 49.6 | 51.1 | 51.6 | 56.1 |
| Germany | 52.2 | 56.4 | 58.2 | 57.8 | 58.3 | 57.1 | 60.7 |
| India | 57.7 | 57.5 | |||||
| Japan | 47.2 | 47.7 | 48.7 | 49.0 | 50.0 | 49.8 | 51.4 |
| Switzerland | 51.8 | 53.1 | 52.3 | 55.2 | 58.0 | 59.4 | 61.3 |
| United Kingdom | 55.2 | 54.1 | 53.7 | 55.6 | 57.5 | 54.1 | 55.1 |
| U.S. PMI provided by Markit | 53.1 | 53.2 | 53.4 | 56.7 | 57.1 | 59.2 | 58.6 |
| U.S. PMI provided by ISM | 56.0 | 55.4 | 59.3 | 57.5 | 60.7 | 58.7 | 60.8 |
| Sep | Oct | Nov | Dec | Jan | Feb | Mar | |
|---|---|---|---|---|---|---|---|
| Share of PMIs Above 50 | 69% | 73% | 77% | 69% | 79% | 77% | 80% |
| Share of PMIs Posting Monthly Increase | 66% | 73% | 63% | 54% | 77% | 63% | 57% |
| Share of PMIs Posting Annual Increase | 71% | 76% | 77% | 74% | 79% | 86% | 74% |
Services PMI
| Jan | Feb | Mar | |
|---|---|---|---|
| JP Morgan Global PMI | 51.8 | 51.6 | 52.8 |
| Developed Markets | 51.1 | 51.6 | 53.2 |
| Emerging Markets | 49.4 | 51.6 | 51.7 |
| Eurozone | 46.4 | 45.4 | 45.7 |
| Australia | 54.2 | 55.6 | 53.4 |
| China | 56.3 | 52.0 | 51.5 |
| France | 49.1 | 47.3 | 45.6 |
| Germany | 47.0 | 46.7 | 45.7 |
| India | 52.8 | 55.3 | |
| Japan | 47.7 | 46.1 | 46.3 |
| United Kingdom | 49.5 | 39.5 | 49.5 |
| U.S. PMI (Markit) | 54.7 | 58.3 | 59.8 |
| U.S. PMI (ISM) | 57.7 | 58.7 | 55.3 |
| Jan | Feb | Mar | |
|---|---|---|---|
| Share of PMIs Above 50 | 42% | 39% | 39% |
| Share of PMIs Posting Monthly Increase | 64% | 31% | 62% |
| Share of PMIs Posting Annual Increase | 29% | 23% | 31% |
Source: Markit, ISM and Ned Davis Research
Economic trends are high neutral YELLOW. The global manufacturing PMI increased 0.4 points to 53.9, and remains near its highest level since March 2018.
80% of countries are in expansion territory with manufacturing PMIs above 50, the highest level since October 2018. 74% of countries have manufacturing PMIs higher than a year ago.
The global services recovery has lagged manufacturing, however the services PMI showed improvement this month with the Global Services PMI increasing 1.2 points to 52.8.
The improvement remains narrow as only 39% of countries have a services PMI above 50 due to economic restrictions, curfews, and preventive actions taken by consumers in order to slow the pandemic until vaccines become more widely distributed.
The level of fiscal stimulus and central bank monetary actions have been unprecedented in the wake of the pandemic. Capital Economics cited an IMF estimate that fiscal support measures taken by governments during the pandemic have so far totaled 12% of global GDP with more stimulus on the way. This compares to 2% of world GDP during the great financial crisis of 2009. The U.S. appears set to pass another round of stimulus which will put them well ahead of other countries with regard to fiscal support.
Asset purchases by the major central banks were $4.8 trillion in 2020, equivalent of more than 5% of GDP.
Without these measures, the economic contraction would have been longer and deeper.
Much of this stimulus was spent on necessities like food and rent, but a meaningful percentage has been saved by households. The private sector savings rate exceeds double digits in many countries.
No doubt some of these savings have flowed into the stock market and other risk assets, but as the economy reopens, some of these savings will be spent, providing a tailwind for economic growth. The rush to spend combined with additional stimulus could stretch capacity for a time, leading to higher inflation rates.
The February U.S. employment report showed a 379,000 increase in non-farm payrolls, boosted by a 355,000 increase in leisure and hospitality employment as some of the Covid-19 restrictions were lifted in response to lower case loads.
Overall U.S. employment levels remain 9.5 million jobs lower than prior to the pandemic. The unemployment rate fell to 6.2%, however, that figure most likely understates the real level of unemployment as 4.2 million people left the labor force in the last year. While some will have retired and left the workforce permanently, others are discouraged or cautious workers who have held off looking for jobs until the pandemic subsides.
With infection rates falling, vaccine distribution continuing and additional fiscal stimulus employment should continue to rebound in the coming months.
The Conference Board Leading Economic Index (LEI)
| 6 Month Rate of Change in the Leading Index | Percent of Subcomponents Higher Than 6 Months Earlier | |
|---|---|---|
| 12/30/2018 | 1.5% | 80.0% |
| 1/31/2019 | 0.8% | 60.0% |
| 2/28/2019 | 0.5% | 60.0% |
| 3/31/2019 | 0.5% | 50.0% |
| 4/30/2019 | 0.6% | 80.0% |
| 5/31/2019 | 0.3% | 50.0% |
| 6/30/2019 | 0.2% | 50.0% |
| 7/31/2019 | 0.8% | 70.0% |
| 8/31/2019 | 0.5% | 70.0% |
| 9/30/2019 | 0.2% | 60.0% |
| 10/31/2019 | -0.1% | 55.0% |
| 11/30/2019 | -0.2% | 60.0% |
| 12/31/2019 | -0.4% | 45.0% |
| 1/31/2020 | 0.1% | 55.0% |
| 2/28/2020 | 0.3% | 80.0% |
| 3/30/2020 | -6.6% | 40.0% |
| 4/30/2020 | -11.3% | 30.0% |
| 5/31/2020 | -10.6% | 15.0% |
| 6/30/2020 | -8.4% | 10.0% |
| 7/31/2020 | -6.8% | 10.0% |
| 8/31/2020 | -4.7% | 40.0% |
| 9/30/2020 | 3.6% | 60.0% |
| 10/31/2020 | 11.7% | 80.0% |
| 11/30/2020 | 9.3% | 80.0% |
| 12/31/2020 | 6.5% | 90.0% |
| 1/31/2021 | 5.1% | 90.0% |
Source: The Conference Board and Ned Davis Research
The improvement in the Conference Board’s Leading Index of U.S. economic indicators slowed with the six-month rate of change at 5.1% compared to 6.5% in the previous period. 90% of the underlying components were higher than six months ago. U.S. recessions are typically preceded by the six-month rate of change for the Conference Board’s Leading Index declining by at least 2% and more than 80% of the leading index underlying components lower than the six months prior.
Market Internals – Yellow
Market internals, such as trend, momentum, and sentiment, are fast variables since they are driven by investor emotion whereas valuations and economic trends tend to change more slowly.
At times, market internals can act as an accelerant that magnifies the prevailing long-term secular trend that is driven by valuations, economic trends, and central bank actions.
At other times, market internals can dampen the prevailing long-term trend.
Adjusting investment portfolios based exclusively on market internals is a trading strategy that can be effective, but is not compatible with the longer-term focus of the Money For the Rest of Us Plus.
Instead, we can combine the faster variables of market internals with the slower variables of valuations and economic and central bank trends in order to identify regime shifts that suggest the risk of a major equity market sell-off is high or, conversely, conditions are in place for a major equity market advance.
Market internals are essentially a swing vote that reinforces or dampens the primary message coming from the slow variables of market valuations and economic and central bank trends.
The following table shows the percentage of stocks and markets that are priced above their 50-day and 200-day moving averages. In other words, how does the current stock price or level of the index compare to the average price over the previous 50 and 200 days.
The reason to monitor this is markets are said to be in gear when there is broad participation in most markets and stocks around the world. For example, data from Ned Davis Research shows that when less than 35% of markets are above their 200-day average that the MSCI All Country World Index has returned -11% per annum. When 85% of markets are above their 200-day moving average the MSCI All Country World Index has returned 19.4% per annum.
Global Equity Market Trend Data as of March 1, 2021
| Sep | Oct | Nov | Dec | Jan | Feb | Mar | |
|---|---|---|---|---|---|---|---|
| Percentage of Global Markets Above 50 Day Moving Average | 53% | 27% | 45% | 96% | 96% | 68% | 66% |
| Percentage of Global Markets Above 200 Day Moving Average | 45% | 41% | 55% | 98% | 98% | 100% | 90% |
| Percentage of Global Stocks Above 50 Day Moving Average | 58% | 45% | 45% | 76% | 73% | 57% | 55% |
| Percentage of Global Stocks Above 200 Day Moving Average | 55% | 53% | 57% | 80% | 79% | 77% | 72% |
| Percent of Global Markets With Rising 200 Day Moving Averages | 27% | 24% | 20% | 22% | 66% | 100% | 100% |
| Percent of Global Stocks With Rising 200 Day Moving Averages | 44% | 39% | 40% | 46% | 80% | 87% | 85% |
Source: Ned Davis Research
Market internals as measured by trend, sentiment, and momentum are high neutral YELLOW as of early March
90% of stock market indices around their world are above their 200-day moving averages and 100% boast rising 200-day moving averages. The majority of individual stocks and markets are also above their 200-day moving averages.
Since the end of October, the equal-weighted MSCI All Country World Index has kept pace with the size-weighted ACWI indicating healthy participation of all stocks in the rally rather than just the largest names.
Momentum indicators, which measure whether the market advance is accelerating are in high neutral territory.
Sentiment measures based on investor surveys show most investors are bullish, but in a healthy sign, their enthusiasm has waned a bit as growth stocks have sold off in the last few weeks. expectations.
Summary
Overall investment conditions are neutral YELLOW with asset class valuations RED, and economic trends and market internals rated high neutral YELLOW.
Economic momentum should accelerate by mid-year-2021 as more individuals are vaccinated for Covid-19. That should ultimately lead to a solid rebound in corporate earnings.
Companies will need to deliver on the elevated earnings expectations priced into stocks. If companies fall short of the lofty expectations, that could leave the stock market vulnerable to a sell-off, particularly if longer-term interest rates rise.
Still, despite the high valuations for stocks, equities will more than likely outperform bonds over the next five to ten years given the low level of interest rates, but investors will need to be patient and ready themselves for some volatile periods.
The following tables provide a summary of market conditions by region.
Asset Class Return Assumptions
These asset class return assumptions are updated semiannually. The most recent update was October 5, 2020.
| 10 Year Expected Nominal Annualized Return | Lower Probable Range | Upper Probable Range | |
|---|---|---|---|
| Global Stocks | 6.00% | 1.80% | 9.10% |
| United States | 5.40% | -0.50% | 8.00% |
| Europe Ex-UK | 6.40% | 4.50% | 10.00% |
| United Kingdom | 8.30% | 5.00% | 11.00% |
| Japan | 5.40% | 4.00% | 10.00% |
| Pacific Ex-Japan | 6.30% | 4.50% | 11.00% |
| Canada | 6.30% | 4.00% | 10.00% |
| Emerging Markets | 7.50% | 5.00% | 11.00% |
| Non-U.S. including Emerging Markets | 6.90% | 4.50% | 10.50% |
| Non-U.S. excluding Emerging Markets | 7.10% | 4.40% | 10.30% |
| Income Strategies | |||
| Equity REITs | 5.80% | 2.00% | 8.00% |
| Mortgage REITs | 6.50% | 2.00% | 10.00% |
| Master Limited Partnerships (MLPs) | 9.00% | -5.00% | 15.00% |
| Preferred Stock | 5.90% | 4.50% | 7.00% |
| Convertible Bonds | 3.50% | 1.00% | 6.00% |
| Asset-based Lending | 6.00% | 4.00% | 8.00% |
| Global Bonds | 0.70% | - | - |
| Global High Yield Bonds | 2.10% | - | - |
| U.S. Bonds | 1.30% | - | - |
| U.S. TIPS | 1.50% | - | - |
| U.S. Municipal Bonds | 0.80% | - | - |
| U.S. High Yield Bonds | 2.80% | - | - |
| U.S Bank Loans | 3.00% | - | - |
| European Bonds | 0.20% | - | - |
| United Kingdom Bonds | 0.50% | - | - |
| Asia Pacific Bonds | 0.70% | - | - |
| Australian Bonds | 0.70% | - | - |
| Emerging Markets Bonds | 4.10% | - | - |
| Cash | 0.10% |