This is the November 2020 investment conditions and strategy report. It includes both a written version and an audio commentary that is part of Plus Episode 320.
Data Download
The following spreadsheet contains monthly valuation, economic trends, and market internal data used in the investment conditions report from December 2015 through the most recent report period.
Purpose of the Investment Conditions and Strategy Report
The purpose of this monthly report is to provide you an objective and concise review of investment conditions.
Understanding investment conditions can help you make portfolio allocation decisions such as increasing exposure to asset classes and regions that are more attractive or reducing exposure to asset classes and regions that are more expensive and where risks are increasing. The report can help you decide when and how to rebalance, whether to dollar cost average, or invest a lump sum all at once.
A periodic review of investment conditions can also give you the confidence and peace of mind to stick to your current allocation by filtering out much of the financial noise so you can focus on where markets stand today relative to their history.
Monitoring investment conditions is helpful for scaling exposure to risky assets such as stocks and non-investment grade bonds as favorable investment conditions generally align with positive investment returns while unfavorable investment conditions have generally been associated with sub-par investment returns.
In this report, investment conditions are segmented into three areas:
- Market valuations – measure how expensive or cheap the global stock market, bonds, and other asset classes are.
- Economic and central bank trends – measure the anticipated direction of the economy based on purchasing managers indices (“PMI”), other leading economic indicators, and how accommodating central banks are with regards to their interest rate policies.
- Market internals – measure market trends and momentum and the level of fear and greed exhibited by investors.
Market valuations, market internals, and economic and central bank trends are rated red for bearish, green for bullish, and yellow for neutral.
When they are red, as they were in early 2008 and 2020, that warrants caution and a more conservative investment approach.
When they are green as they were in mid-2009 coming out of the Great Financial Crisis, then that provides an opportunity to increase portfolio risk and generate higher returns.
By design, the metrics covered in this report are streamlined to focus on the most relevant data for navigating an uncertain world. Having more data does not necessarily lead to better investment decisions. Rather, this report focuses on building blocks that influence future returns for asset classes such as:
- Current dividend yields, earnings yields, and interest rate yields relative to historical trends. Higher yields equate to higher future returns.
- How investors are valuing cash flows and earnings. When investors place a low value on earnings and cash flows, such as when earnings yields and dividend yields are high and price-to-earnings ratios low, then that can lead to higher future returns.
- Whether the risk of a recession is increasing or decreasing, as measured by PMI and other leading economic indicators. Economic trends impact corporate profits, financial stress, and investor expectations.
- Whether central bank actions are putting upward pressure or downward pressure on interest rates, which can lead to changes in asset class valuations and investor expectations.
- How broad or narrow is the prevailing market trends in terms of the percentage of stocks and stock markets in an uptrend or downtrend? A healthy market is denoted by broad participation with investors neither overly fearful or overly zealous. An unhealthy market has divergences or movements opposite the existing trend that can be a sign of mounting risks that may warrant adjusting exposures.
Historical Investment Conditions
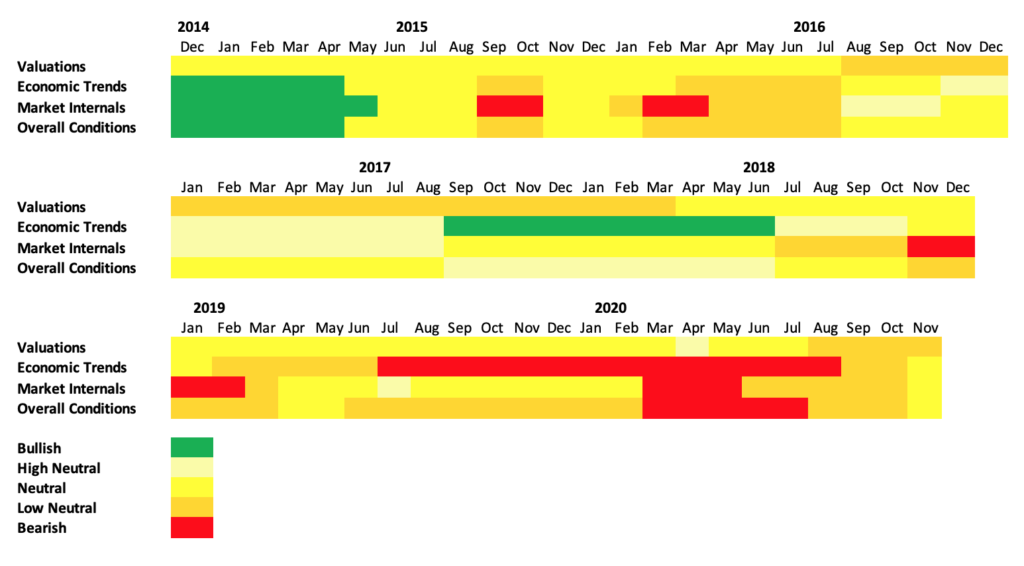
Overall Global Investment Conditions Are YELLOW

As of early November 2020, overall investment conditions are neutral YELLOW.
The global economy continues to rebound from the Covid-19 induced shutdown in the first half of 2020. Economic output increased significantly in the third quarter, and leading indicators suggest the global economy will continue to improve. The global composite PMI, which includes both manufacturing and services, increased to 53.3, its highest level since August 2018.
The global manufacturing PMI rose to 53.0, its highest level since April 2018. It has jumped over 13 points since its April low.
Covid-19 cases continue to grow with several European countries reestablishing nationwide lockdowns. These lockdowns are less restrictive than those from the March to May period with schools remaining opening, construction continuing and most manufacturing plants continuing to produce.
In the U.S., Covid-19 cases are also increasing, but not as fast as in Europe. Better treatments and a lower average age of those infected have led to a reduced rate of hospitalizations and deaths.
Asian countries have not seen a spike in cases, allowing their economies to continue to recover.
While additional shutdowns will weigh on economic growth, as the Covid-19 pandemic approaches its one year anniversary, households and businesses have adapted. While there will be economic disruptions, there is less risk of a renewed global recession. In addition, development continues on a Covid-19 vaccine with the first vaccines anticipated to be available in the first quarter of 2021.
Given the steady economic improvement coupled with more favorable market internals with the majority of stocks in an uptrend, the adaptive model portfolios were adjusted in early November to shift 10% from cash to stocks.
Overall investment conditions have gradually improved since the depth of the crisis in mid-March. This improvement warranted incremental increases in portfolio risk including higher allocations to common stocks, preferred equities, and corporate bonds despite the uncertainty.
The worst of the economic fallout from the pandemic appears to be behind us. Government and central banks have proactively provided support to households and businesses. Employment has increased and corporate profits have bottomed and are expected to grow.
While there will still be market sell-offs, the risk of a major bear market arising from a prolonged economic contraction is low. Consequently, investors with a longer-term time horizon can feel more confident gradually increasing risk.
Market Returns
Global stocks fell 2.5% in October, but have rallied over 7% so far in November, taking the MSCI All Country World Index back into positive territory year-to-date.
The following table provides an overview of equity market returns:
Global Stock Market Returns For the Periods Ending October 31, 2020
| OCT (USD) | YTD (USD) | OCT (LOCAL) | YTD (LOCAL) | |
|---|---|---|---|---|
| ACWI All Country World Index | -2.40% | -1.10% | -2.50% | -1.30% |
| AC Americas | -2.60% | 2.30% | -2.60% | 3.00% |
| U.S.A | -2.60% | 4.00% | -2.60% | 4.00% |
| Canada | -3.30% | -10.60% | -3.50% | -8.10% |
| AC Asia | 1.10% | 4.20% | 0.40% | 2.20% |
| AC Asia Pacific Ex-Japan | 2.40% | 5.20% | 2.10% | 4.80% |
| Japan | -1.60% | -2.30% | -2.50% | -6.00% |
| Australia | 0.00% | -11.50% | 2.10% | -11.40% |
| AC Europe | -5.80% | -14.80% | -5.40% | -16.30% |
| Europe Ex-UK | -5.80% | -9.40% | -5.40% | -12.90% |
| France | -4.80% | -17.70% | -4.20% | -20.70% |
| Germany | -10.30% | -10.20% | -9.70% | -13.50% |
| Switzerland | -5.60% | -2.60% | -5.80% | -7.80% |
| United Kingdom | -5.10% | -27.30% | -5.10% | -25.50% |
| Emerging Markets | 2.10% | 0.90% | 1.50% | 4.20% |
| Emerging Latin America | -1.10% | -36.80% | -0.70% | -18.00% |
| Emerging Asia | 3.30% | 11.60% | 2.50% | 10.80% |
| Emerging Europe & Middle East | -6.10% | -24.10% | -4.90% | -16.10% |
Source: MSCI
Bond Market and Income Strategy Returns
Global bonds were flat in October, but have rallied in November as interest rates fell after the U.S. election. Given Congress remains deadlocked with neither the Democrats nor Republicans establishing a large majority, there is less likelihood the U.S. will undertake massive spending increases.
Fixed Income Returns For the Periods Ending October 31, 2020
| Unhedged Index | OCT (USD) | YTD (USD) |
|---|---|---|
| Multiverse | 0.1% | 5.4% |
| Global Aggregate | 0.1% | 5.8% |
| Global High-Yield | 0.1% | -0.5% |
| U.S. Aggregate | -0.5% | 6.3% |
| U.S. Corporate High-Yield | 0.5% | 1.1% |
| S&P/LSTA U.S. Leveraged Loan 100 Index | -0.4% | -0.9% |
| U.S. Municipal | -0.3% | 3.0% |
| Emerging Markets USD | -0.1% | 1.8% |
| Emerging Markets Local Govt | 1.3% | -0.3% |
| OCT (EUR) | YTD (EUR) | |
| Pan European Aggregate | 0.7% | 2.8% |
| Euro Aggregate | 0.8% | 3.6% |
| OCT (GBP) | YTD (GBP) | |
| Sterling Aggregate | -0.4% | 6.5% |
| OCT (JPY) | YTD (JPY) | |
| Asian Pacific Aggregate | 0.1% | -0.2% |
Source: Bloomberg
Income strategies with the exception of MLPs sold off in October, but REITs, Preferred Stocks, and MLPs have all posted solid gains in November.
Income Strategies and Commodity Returns for Periods Ending October 31, 2020
| OCT (USD) | YTD (USD) | |
|---|---|---|
| Down Jones Equity All REIT Index | -3.3% | -15.0% |
| S&P Global REIT Index | -3.1% | -21.1% |
| S&P U.S. Preferred Stock Index | 0.4% | 1.4% |
| Alerian MLP Index Total Return Index | 4.4% | -43.8% |
| S&P GSCI Commodity Index | -3.6% | -35.8% |
Source: Alerian and S&P Dow Jones
Market Valuations – YELLOW

Market valuations are low neutral YELLOW. A rebound in stocks at a time when earnings are falling and dividends are being cut has led to increased valuations that are above average for global stocks, as measured by the MSCI All Country World Index.
The good news is global earnings are expected to increase by close to 20% in the next year, which should lead to lower valuations for stocks.
The global earnings yield at 4.1% is near the lowest it has been since 2010, a time when earnings collapsed coming out of the Great Financial Crisis. The lower the earnings yield, the more expensive the valuation.
Global forward earnings yield based on analysts’ earnings expectations is 5.1%, close to its lowest level in 18 years. The average forward earnings yield going back to 2002 is 7.4%.
Global stocks are also expensive based on dividend yields. The 2% dividend yield for the MSCI All Country World Index is at its lowest level since 2007.
During a recession, the cyclically-adjusted price-to-earnings ratio becomes a more relevant valuation measure for stocks as it uses the average earnings over the past decade rather than data for the past year which can distort valuations due to falling earnings. Global stocks have a cyclically-adjusted P/E of 21.6, above the long-term average of 20.7.
The U.S. stock market is greater than one standard deviation above average based on earnings yield, dividend yield, and cyclically-adjusted price-to-earnings ratios. At 1.6%, the dividend yield for U.S. stocks is the lowest since 2000.
The U.S. forward earnings yield based on expectations for corporate profit growth is 4.4%, two standard deviations more expensive than the average forward earnings yield of 6.8% going back to 2003.
Global earnings expectations improved again this month based on bottom-up company forecasts by equity analysts. Global earnings are expected to increase by 19.4% over the next year compared to the 15.4% one-year earnings forecast last month. Global earnings have fallen 21% over the past year, led by the energy sector where earnings have fallen 85%.
U.S. earnings are expected to increase by 16.0% in the next year compared to an expectation of a 13.4% year-over-year earnings growth last month. U.S. earnings have fallen 15.5% in the past year.
The percentage of global publicly-traded companies with positive earnings revisions reached 78%, its highest level in over 20 years. A high rate of positive earnings revision has been a meaningful leading indicator of strong earnings growth. 83% of U.S. publicly traded companies have increased earnings estimates, down slightly from 85% of companies last month, but up 12 percentage points from a year ago.
Increased corporate profits and dividends are needed in order for valuations to improve.
For the third quarter 2020 earnings season, 72% of global companies have exceeded analysts’ earnings estimates with 40% of companies reporting. This compares to 64% in the second quarter and a long-term average of 63%.
85% of U.S. companies beat analysts’ earnings estimates in Q3 2020 with 72% of companies reporting. This compares to 82% of companies in the second quarter and the long-term average beat rate of 73%.
Earnings Yields as of November 1, 2020
| Sep Earnings Yield | Oct Earnings Yield | Nov Earnings Yield | Historical Average Earnings Yield | Historical Average Starting Year | Standard Deviations From Average | Favorable or Unfavorable Versus Average | |
|---|---|---|---|---|---|---|---|
| All Country World | 4.3% | 4.2% | 4.1% | 5.2% | 1995 | 0.9 | Unfavorable |
| World (Developed) | 4.1% | 4.0% | 4.0% | 6.3% | 1970 | 1.0 | Unfavorable |
| World ex U.S. | 5.5% | 4.9% | 4.9% | 6.4% | 1970 | 0.5 | Unfavorable |
| Developed Asia | 6.4% | 4.8% | 4.8% | 4.3% | 1973 | 0.4 | Favorable |
| Asia Pacific ex. Japan | 5.0% | 5.2% | 5.0% | 6.5% | 1995 | 0.9 | Unfavorable |
| Japan | 4.6% | 4.7% | 4.7% | 4.0% | 1969 | 0.3 | Favorable |
| Europe | 5.8% | 5.0% | 5.1% | 7.5% | 1969 | 0.8 | Unfavorable |
| Europe ex. UK | 5.1% | 4.7% | 4.8% | 6.8% | 1974 | 0.7 | Unfavorable |
| U.K. | 8.5% | 6.4% | 6.2% | 8.5% | 1969 | 0.3 | Unfavorable |
| Emerging Markets | 5.4% | 5.4% | 5.3% | 6.9% | 1995 | 1.1 | Unfavorable |
| Emerging Asia | 5.2% | 5.2% | 5.1% | 6.2% | 1995 | 0.6 | Unfavorable |
| Emerging Europe | 10.5% | 9.0% | 9.1% | 10.1% | 1996 | 0.2 | Unfavorable |
| Emerging Latin America | 4.8% | 4.9% | 4.7% | 6.9% | 1995 | 1.3 | Unfavorable |
| Frontier Markets | 7.5% | 7.1% | 6.9% | 8.2% | 2008 | 0.7 | Unfavorable |
| Australia | 5.5% | 4.8% | 4.5% | 6.9% | 1970 | 1.2 | Unfavorable |
| Canada | 4.6% | 4.4% | 4.5% | 6.3% | 1969 | 0.7 | Unfavorable |
| China | 5.4% | 5.5% | 5.3% | 7.3% | 1995 | 1.0 | Unfavorable |
| France | 5.4% | 4.0% | 3.9% | 6.6% | 1971 | 0.7 | Unfavorable |
| Germany | 4.4% | 4.5% | 4.7% | 6.8% | 1969 | 0.7 | Unfavorable |
| Switzerland | 5.1% | 4.8% | 5.0% | 6.8% | 1969 | 0.6 | Unfavorable |
| U.S. | 3.4% | 3.5% | 3.5% | 6.8% | 1969 | 1.3 | Unfavorable |
Source: Ned Davis Research and MSCI
Note: The earnings yield figures are based on trailing twelve-month earnings. Earnings yield is the inverse of the price-to-earnings ratio. The lower the earnings yield, the more expensive the valuation. Standard deviation measures how far outside of the norm the earnings yield is. The higher the standard deviation the further the current measure is from the average. Standard deviations listed in red denote a market that is more expensive than average while those in black are at their average or cheaper than average.
Dividend Yields as of November 1, 2020
| Sep Dividend Yield | Oct Dividend Yield | Nov Dividend Yield | Historical Average Earnings Yield | Historical Average Starting Year | Standard Deviations From Average | Favorable or Unfavorable Versus Average | |
|---|---|---|---|---|---|---|---|
| All Country World | 1.9% | 2.0% | 2.0% | 2.2% | 1995 | 0.5 | Unfavorable |
| World (Developed) | 1.9% | 2.0% | 2.0% | 2.9% | 1970 | 0.9 | Unfavorable |
| World ex U.S. | 2.7% | 2.7% | 2.7% | 3.0% | 1970 | 0.3 | Unfavorable |
| Asia | 2.6% | 2.6% | 2.6% | 1.9% | 1973 | 0.8 | Favorable |
| Asia Pacific ex. Japan | 2.4% | 2.3% | 2.4% | 2.9% | 1995 | 0.9 | Unfavorable |
| Japan | 2.3% | 2.3% | 2.2% | 1.7% | 1969 | 0.7 | Favorable |
| Europe | 2.6% | 2.7% | 2.7% | 3.8% | 1969 | 0.9 | Unfavorable |
| Europe ex. UK | 2.3% | 2.4% | 2.4% | 3.6% | 1974 | 1.0 | Unfavorable |
| U.K. | 3.9% | 3.9% | 3.7% | 4.2% | 1969 | 0.2 | Unfavorable |
| Emerging Markets | 2.2% | 2.3% | 2.3% | 2.5% | 1995 | 0.3 | Unfavorable |
| Emerging Asia | 2.0% | 2.0% | 2.0% | 2.1% | 1995 | 0.2 | Unfavorable |
| Emerging Europe | 4.8% | 5.5% | 5.2% | 2.6% | 1996 | 2.0 | Favorable |
| Emerging Latin America | 2.9% | 3.2% | 3.1% | 3.0% | 1995 | 0.1 | Favorable |
| Frontier Markets | 4.0% | 3.8% | 3.8% | 4.2% | 2008 | 0.3 | Unfavorable |
| Australia | 3.5% | 3.5% | 3.3% | 4.1% | 1970 | 0.8 | Unfavorable |
| Canada | 3.2% | 3.3% | 3.3% | 3.0% | 1969 | 0.3 | Favorable |
| China | 1.6% | 1.7% | 1.6% | 2.5% | 1995 | 1.2 | Unfavorable |
| France | 2.1% | 2.2% | 2.2% | 3.9% | 1971 | 1.1 | Unfavorable |
| Germany | 2.5% | 2.7% | 2.9% | 3.4% | 1969 | 0.4 | Unfavorable |
| Switzerland | 2.9% | 2.8% | 2.9% | 2.4% | 1969 | 0.5 | Favorable |
| U.S. | 1.5% | 1.6% | 1.6% | 3.0% | 1969 | 1.0 | Unfavorable |
Source: Ned Davis Research and MSCI
Note: The dividend yield figures are based on trailing twelve-month dividends. Standard deviation measures how far outside of the norm the dividend yield is. The higher the standard deviation the further the current measure is from the average. Standard deviations listed in red denote a market with a dividend yield lower than average while those in black are markets with dividend yields that are at their average or higher than average.
Equity Cyclically-Adjusted Price-to-Earnings Ratios as of November 1, 2020
| Sep Cyclically-Adjusted Price-to-Earnings | Oct Cyclically-Adjusted Price-to-Earnings | Nov Cyclically-Adjusted Price-to-Earnings | Historical Median Price-to-Earnings | Standard Deviation From Median | Favorable or Unfavorable Versus Median | |
|---|---|---|---|---|---|---|
| All Country World | 22.7 | 21.6 | 21.6 | 20.7 | 0.1 | Unfavorable |
| AC Asia Pacific ex. Japan | 15.8 | 15.3 | 15.9 | 17.2 | 0.3 | Favorable |
| Pacific ex. Japan | 13.9 | 13.2 | 13.6 | 16.9 | 0.7 | Favorable |
| Japan | 17.9 | 17.8 | 17.8 | 36.2 | 0.8 | Favorable |
| Europe | 15.7 | 15.1 | 14.9 | 16.9 | 0.3 | Favorable |
| Europe ex. UK | 17.9 | 17.4 | 17.4 | 18.8 | 0.2 | Favorable |
| U.K. | 10.9 | 10.4 | 10.4 | 14.7 | 1.0 | Favorable |
| Emerging Markets | 13.7 | 13.3 | 13.7 | 14.9 | 0.2 | Favorable |
| Australia | 14.1 | 13.4 | 13.8 | 16.2 | 0.4 | Favorable |
| Canada | 17.5 | 16.6 | 16.6 | 17.9 | 0.1 | Favorable |
| China | 16.9 | 16.1 | 17.0 | 16.2 | 0.1 | Unfavorable |
| France | 17.0 | 16.2 | 16.2 | 19.3 | 0.4 | Favorable |
| Germany | 15.7 | 15.0 | 14.1 | 18.1 | 0.5 | Favorable |
| Switzerland | 24.2 | 23.5 | 23.1 | 22.1 | 0.1 | Unfavorable |
| U.S. | 31.8 | 29.9 | 29.7 | 20.6 | 1.1 | Unfavorable |
Source: Ned Davis Research and MSCI
Note: Cyclically-adjusted P/E Ratios also known as Shiller P/E’s are based on the previous 10-year average earnings using MSCI Indices. One important consideration when making valuation judgments using 10-year earnings is whether the previous decade reflects the earnings potential going forward. In other words, are there outliers in the historical earnings record that are not repeatable? Standard deviation measures how far outside of the norm the cyclically-adjusted P/E ratio is. The higher the standard deviation the further the current measure is from the average. Standard deviations listed in red denote a market that is more expensive than its historical average while those in black are markets that are at their average or cheaper than average.
Bond and Income Strategy Valuations as of November 1, 2020
The following section reviews the absolute yield and the incremental yield or spreads for bonds and other income-oriented strategies. The comparisons allow you to see whether the spread is higher or lower than its long-term average. An asset category is more attractive when its spread is wider than its long-term average and less attractive when the spread is narrower than its long-term average.
Incremental yields for corporate and investment-grade bonds relative to government bonds have narrowed to close to their long-term averages, even though default rates are expected to be well above average.
| Sep | Oct | Nov | |
|---|---|---|---|
| Alerian MLP Dividend Yield | 12.5% | 15.1% | 13.1% |
| MLP Incremental Yield Above 10 Year Treasuries | 11.8% | 14.4% | 12.2% |
| 20 Year Median Incremental MLP Yield Over 10-Year Treasuries | 3.6% | 3.6% | 3.6% |
| NAREIT All REIT Dividend Yield (includes mortgage reits) | 4.1% | 4.1% | 4.3% |
| 20 Year All REIT Dividend Yield Average | 5.2% | 5.2% | 5.2% |
| NAREIT Equity REIT Dividend Yield | 3.7% | 3.8% | 4.0% |
| 20 Year Equity REIT Dividend Yield Average | 4.7% | 4.7% | 4.7% |
| Equity REIT Yield Above 10-Year Treasuries | 3.0% | 3.2% | 3.1% |
| 20 Year Average REIT Yield Above 10-Year Treasuries | 1.4% | 1.4% | 1.4% |
| NAREIT Mortgage REIT Dividend Yield | 10.6% | 10.5% | 10.7% |
| 20 Year All REIT Dividend Yield Average | 11.6% | 11.6% | 11.6% |
| Equity REIT Price to Funds from Operations | 18.7 | 17.7 | 19.8 |
| Equity REIT Price to Funds from Operations Long-term Average | 16.3 | 16.3 | 16.3 |
| MLP Incremental Yield Above REIT Yield | 8.4% | 11.0% | 8.8% |
| 20 Year Median Incremental MLP Yield Over REIT Yield | 1.8% | 1.8% | 1.9% |
| U.S. Corporate High Yield Bonds Yield To Worst | 5.3% | 5.8% | 5.8% |
| U.S. High Yield Incremental Yield (i.e., Spread) Above 10 Year Treasuries | 4.6% | 5.1% | 4.9% |
| Average Incremental Yield Since 1983 | 4.9% | 4.9% | 4.9% |
| U.S. Bank Loan (i.e., Leveraged Loan) Yield | 4.8% | 4.9% | 4.8% |
| U.S. Bank Loan Yield Above 3 month Eurodollar Yield | 4.4% | 4.4% | 4.6% |
| Average Incremental Yield Since 2012 | 4.4% | 4.4% | 4.4% |
| U.S. Investment Grade Corporate Bonds Yield To Worst | 2.0% | 2.0% | 2.0% |
| U.S. Investment Grade Incremental Yield (i.e., Spread) Above 10 Year Treasuries | 1.2% | 1.3% | 1.2% |
| Average Incremental Yield Since 1973 | 1.1% | 1.1% | 1.1% |
| U.S. Mortgage-Backed Securities Yield To Worst | 1.3% | 1.3% | 1.4% |
| U.S. MBS Incremental Yield (i.e., Spread) Above 10 Year Treasuries | 0.6% | 0.6% | 0.5% |
| Average Incremental Yield Since 1989 | 0.6% | 0.6% | 0.6% |
| Emerging Market Yields | 4.2% | 4.1% | 4.1% |
| Emerging Market Incremental Yield (i.e., Spread) Above 10 Year Treasuries | 3.5% | 3.4% | 3.2% |
| Average Incremental Yield Since 1997 | 4.1% | 4.1% | 4.1% |
| U.S. Real 5-Year Yield | -1.4% | -1.2% | -1.2% |
| Nominal 5-Year Yield minus Real 5-Year Yield | 1.5% | 1.5% | 1.6% |
| U.S. Real 7-Year Yield | -1.2% | -1.1% | -1.1% |
| Nominal 7-Year Yield minus Real 7-Year Yield | 1.6% | 1.6% | 1.7% |
| U.S. Real 10-Year Yield | -1.1% | -1.0% | -0.8% |
| Nominal 10-Year Yield minus Real 10-Year Yield | 1.6% | 1.6% | 1.7% |
| U.S. 10-Year Treasury Yield | 0.7% | 0.7% | 0.9% |
Source: Ned Davis Research
Economic and Central Bank Trends – YELLOW
The most robust data set for understanding global economic growth trends is Purchasing Manager Indices (PMIs), which are monthly surveys of businesses conducted by Markit and other providers.
There are both Manufacturing and Services PMI surveys conducted each month. Generally, a reading above 50 suggests an economy is expanding while a reading below 50 suggests an economy is contracting.
This report focuses on Manufacturing PMIs as they are more cyclical and have a longer and more accurate history of predicting global recessions.
The following table provides an overview of global PMI as well as select regions and countries.
PMI Data As of November 1, 2020
| May | June | July | Aug | Sep | Oct | Nov | |
|---|---|---|---|---|---|---|---|
| JP Morgan Global PMI | 39.8 | 42.4 | 47.8 | 50.3 | 51.8 | 52.3 | 53.0 |
| Developed Markets | 36.8 | 39.5 | 46.4 | 49.8 | 51.2 | 52.2 | 52.8 |
| Emerging Markets | 42.7 | 45.4 | 49.6 | 51.4 | 52.5 | 52.8 | 53.4 |
| Eurozone | 33.4 | 39.4 | 47.4 | 51.8 | 51.7 | 53.7 | 54.8 |
| Australia | 44.1 | 44.0 | 51.2 | 54.0 | 53.6 | 55.4 | 54.2 |
| Canada | 33.0 | 40.6 | 47.8 | 52.9 | 55.1 | 56.0 | 55.5 |
| China | 49.4 | 50.7 | 51.2 | 52.8 | 53.1 | 53.0 | 53.6 |
| France | 31.5 | 40.6 | 52.3 | 52.4 | 49.8 | 51.2 | 51.3 |
| Germany | 34.5 | 36.6 | 45.2 | 51.0 | 52.2 | 56.4 | 58.2 |
| Japan | 41.9 | 38.4 | 40.1 | 45.2 | 47.2 | 47.7 | 48.7 |
| Switzerland | 40.7 | 42.1 | 41.9 | 49.2 | 51.8 | 53.1 | 52.3 |
| United Kingdom | 32.6 | 40.7 | 50.1 | 53.3 | 55.2 | 54.1 | 53.7 |
| U.S. PMI provided by Markit | 36.1 | 39.8 | 49.8 | 50.9 | 53.1 | 53.2 | 53.4 |
| U.S. PMI provided by ISM | 41.5 | 43.1 | 52.6 | 54.2 | 56.0 | 55.4 | 59.3 |
| May | June | July | Aug | Sep | Oct | Nov | |
|---|---|---|---|---|---|---|---|
| Share of PMIs Above 50 | 0% | 9% | 31% | 63% | 69% | 73% | 77% |
| Share of PMIs Posting Monthly Increase | 3% | 86% | 94% | 80% | 66% | 73% | 63% |
| Share of PMIs Posting Annual Increase | 0% | 9% | 37% | 66% | 71% | 76% | 77% |
Source: Markit, ISM and Ned Davis Research
Economic trends are neutral YELLOW, upgraded from low neutral last month. The global economy continues to rebound from the Covid-19 induced shutdown. The global composite PMI, which includes both manufacturing and services, increased to 53.3, its highest level since August 2018.
The global manufacturing PMI rose to 53.0, its highest level since April 2018. It has jumped over 13 points since its April low.
77% of countries are in expansion territory with manufacturing PMIs above 50, the highest level since November 2018.
The output and new orders components of manufacturing PMI increased to their highest levels since early 2018.
The November U.S. employment report showed 638,000 new jobs created, but that number was held back by 147,000 temporary U.S. census jobs that ended. Overall, private employment increased by 906,000.
The U.S. unemployment rate fell to 6.9% from 7.9% last month. Following the 2008 to 2009 Great Financial Crisis, it took until 2013 for the U.S. unemployment rate to fall to 6.9%. The quick rebound in employment is evidence that this recession was caused by the deliberate shutdown of the economy rather than due to the unwinding of economic excesses.
The Conference Board Leading Economic Index (LEI)
| 6 Month Rate of Change in the Leading Index | Percent of Subcomponents Higher Than 6 Months Earlier | |
|---|---|---|
| 12/30/2018 | 1.5% | 80.0% |
| 1/31/2019 | 0.8% | 60.0% |
| 2/28/2019 | 0.5% | 60.0% |
| 3/31/2019 | 0.5% | 50.0% |
| 4/30/2019 | 0.6% | 80.0% |
| 5/31/2019 | 0.3% | 50.0% |
| 6/30/2019 | 0.2% | 50.0% |
| 7/31/2019 | 0.8% | 70.0% |
| 8/31/2019 | 0.5% | 70.0% |
| 9/30/2019 | 0.2% | 60.0% |
| 10/31/2019 | -0.1% | 55.0% |
| 11/30/2019 | -0.2% | 60.0% |
| 12/31/2019 | -0.4% | 45.0% |
| 1/31/2020 | 0.1% | 55.0% |
| 2/28/2020 | 0.3% | 80.0% |
| 3/30/2020 | -6.6% | 40.0% |
| 4/30/2020 | -11.3% | 30.0% |
| 5/31/2020 | -10.6% | 15.0% |
| 6/30/2020 | -8.4% | 10.0% |
| 7/31/2020 | -6.8% | 10.0% |
| 8/31/2020 | -4.7% | 40.0% |
| 9/30/2020 | 3.6% | 60.0% |
| 10/31/2020 | 11.7% | 80.0% |
| 11/30/2020 | 9.3% | 80.0% |
| 12/31/2020 | 6.5% | 90.0% |
| 1/31/2021 | 5.1% | 90.0% |
| 2/28/2021 | 3.4% | 90.0% |
Source: The Conference Board and Ned Davis Research
The Conference Board’s Leading Index of U.S. economic indicators was much improved in the most recent release that extends through September 2020. The six-month rate of change was a positive 3.6% compared to -4.7% last month. 60% of the underlying components were higher than six months ago. U.S. recessions are typically preceded by the six-month rate of change for the Conference Board’s Leading Index declining by at least 2% and more than 80% of the leading index underlying components lower than the six months prior.
The rebound in the Conference Board Leading Index is evidence the U.S. is recovering from the 2020 recession.
Most central banks around the world have cut short-term interest rates and launched lending and asset purchases programs to combat the global recession. All indications are that central banks will keep their policy rates near zero or below for many months, as well as pursue other measures to keep longer-term rates low, such as the recent policy change by the Federal Reserve to allow for higher levels of inflation.
Market Internals – Yellow
Market internals, such as trend, momentum, and sentiment, are fast variables since they are driven by investor emotion whereas valuations and economic trends tend to change more slowly.
At times, market internals can act as an accelerant that magnifies the prevailing long-term secular trend that is driven by valuations, economic trends, and central bank actions.
At other times, market internals can dampen the prevailing long-term trend.
Adjusting investment portfolios based exclusively on market internals is a trading strategy that can be effective, but is not compatible with the longer-term focus of the Money For the Rest of Us Plus.
Instead, we can combine the faster variables of market internals with the slower variables of valuations and economic and central bank trends in order to identify regime shifts that suggest the risk of a major equity market sell-off is high or, conversely, conditions are in place for a major equity market advance.
Market internals are essentially a swing vote that reinforces or dampens the primary message coming from the slow variables of market valuations and economic and central bank trends.
The following table shows the percentage of stocks and markets that are priced above their 50-day and 200-day moving averages. In other words, how does the current stock price or level of the index compare to the average price over the previous 50 and 200 days.
The reason to monitor this is markets are said to be in gear when there is broad participation in most markets and stocks around the world. For example, data from Ned Davis Research shows that when less than 35% of markets are above their 200-day average that the MSCI All Country World Index has returned -11% per annum. When 85% of markets are above their 200-day moving average the MSCI All Country World Index has returned 19.4% per annum.
Global Equity Market Trend Data as of November 1, 2020
| May | June | July | Aug | Sep | Oct | Nov | ||||
|---|---|---|---|---|---|---|---|---|---|---|
| Percentage of Global Markets Above 50 Day Moving Average | 47% | 98% | 96% | 63% | 53% | 27% | 45% | I5210 | ||
| Percentage of Global Markets Above 200 Day Moving Average | 6% | 27% | 39% | 39% | 45% | 41% | 55% | i5205 | ||
| Percentage of Global Stocks Above 50 Day Moving Average | 55% | 85% | 80% | 60% | 58% | 45% | 45% | IGP2000 | ||
| Percentage of Global Stocks Above 200 Day Moving Average | 24% | 36% | 50% | 50% | 55% | 53% | 57% | IGP2000 | ||
| Percent of Global Markets With Rising 200 Day Moving Averages | 8% | 8% | 25% | 29% | 27% | 24% | 20% | i84 | ||
| Percent of Global Stocks With Rising 200 Day Moving Averages | 25% | 31% | 40% | 44% | 44% | 39% | 40% | IGP2000B |
Source: Ned Davis Research
Market internals as measured by trend, sentiment, and momentum are neutral YELLOW as of early November, upgraded from low neutral last month.
With stock markets rebounding sharply in early November, trend data has improved and is solidly in neutral territory. 57% of stocks are above their 200 day moving average, the highest since January 2020.
Momentum indicators, which measure whether the market advance is accelerating have improved and are also in neutral territory.
The fourth quarter has traditionally been the strongest period for the global stock market and with much of the uncertainty regarding the U.S. elections out of the way and global earnings expectations improving, it is possible the current rally could continue, consistent with its seasonality pattern.
Sentiment measures based on investor surveys are neutral with investors neither overly bullish nor bearish.
Summary
Overall investment conditions are low neutral YELLOW with market valuations, economic trends, and market internals all rated YELLOW.
Investment conditions have gradually improved since the depth of the crisis in mid-March. This improvement warranted incremental increases in portfolio risk including higher allocations to common stocks, preferred equities, and corporate bonds despite the uncertainty.
Nevertheless, above-average valuations, a modest jobs recovery, lackluster earnings, a narrow market advance, an ongoing pandemic, and a potentially volatile U.S. presidential election warrant a cautious investment approach.
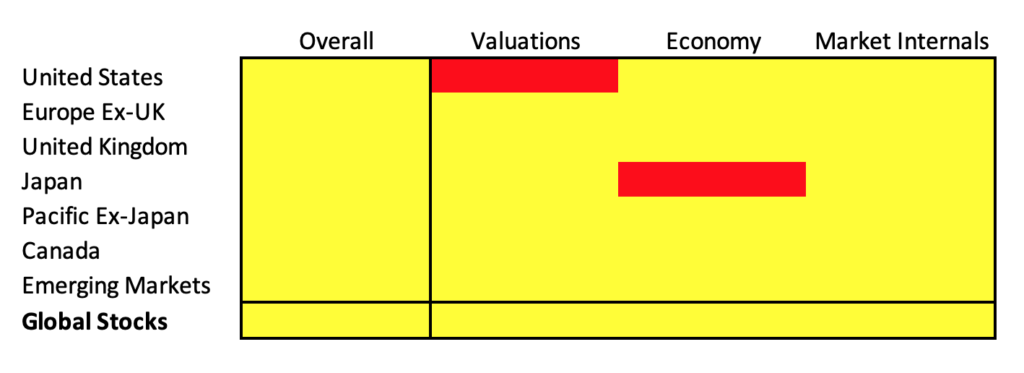
The following tables provide a summary of market conditions by region.
Asset Class Return Assumptions
These asset class return assumptions are updated semiannually. The most recent update was October 5, 2020.
| 10 Year Expected Nominal Annualized Return | Lower Probable Range | Upper Probable Range | |
|---|---|---|---|
| Global Stocks | 6.00% | 1.80% | 9.10% |
| United States | 5.40% | -0.50% | 8.00% |
| Europe Ex-UK | 6.40% | 4.50% | 10.00% |
| United Kingdom | 8.30% | 5.00% | 11.00% |
| Japan | 5.40% | 4.00% | 10.00% |
| Pacific Ex-Japan | 6.30% | 4.50% | 11.00% |
| Canada | 6.30% | 4.00% | 10.00% |
| Emerging Markets | 7.50% | 5.00% | 11.00% |
| Non-U.S. including Emerging Markets | 6.90% | 4.50% | 10.50% |
| Non-U.S. excluding Emerging Markets | 7.10% | 4.40% | 10.30% |
| Income Strategies | |||
| Equity REITs | 5.80% | 2.00% | 8.00% |
| Mortgage REITs | 6.50% | 2.00% | 10.00% |
| Master Limited Partnerships (MLPs) | 9.00% | -5.00% | 15.00% |
| Preferred Stock | 5.90% | 4.50% | 7.00% |
| Convertible Bonds | 3.50% | 1.00% | 6.00% |
| Asset-based Lending | 6.00% | 4.00% | 8.00% |
| Global Bonds | 0.70% | - | - |
| Global High Yield Bonds | 2.10% | - | - |
| U.S. Bonds | 1.30% | - | - |
| U.S. TIPS | 1.50% | - | - |
| U.S. Municipal Bonds | 0.80% | - | - |
| U.S. High Yield Bonds | 2.80% | - | - |
| U.S Bank Loans | 3.00% | - | - |
| European Bonds | 0.20% | - | - |
| United Kingdom Bonds | 0.50% | - | - |
| Asia Pacific Bonds | 0.70% | - | - |
| Australian Bonds | 0.70% | - | - |
| Emerging Markets Bonds | 4.10% | - | - |
| Cash | 0.10% |