This investment strategy report is also available in audio format in the Plus member audio feed.
Investment conditions reports from earlier periods can be found here.
You can view a printable version of the investment conditions here.
What Happened?
Global stocks, as measured by the MSCI All Country World Index, rose 2.5% in USD terms in August, led by non-U.S. developed markets and frontier markets. Year-to-date, global stocks have returned over 14% while non-U.S. developed stocks and emerging markets have returned over 19% in USD terms.

After the rebound in U.S. large-cap growth stocks last month, value and small-cap strategies reasserted leadership as some of the best-performing areas in August and year-to-date.
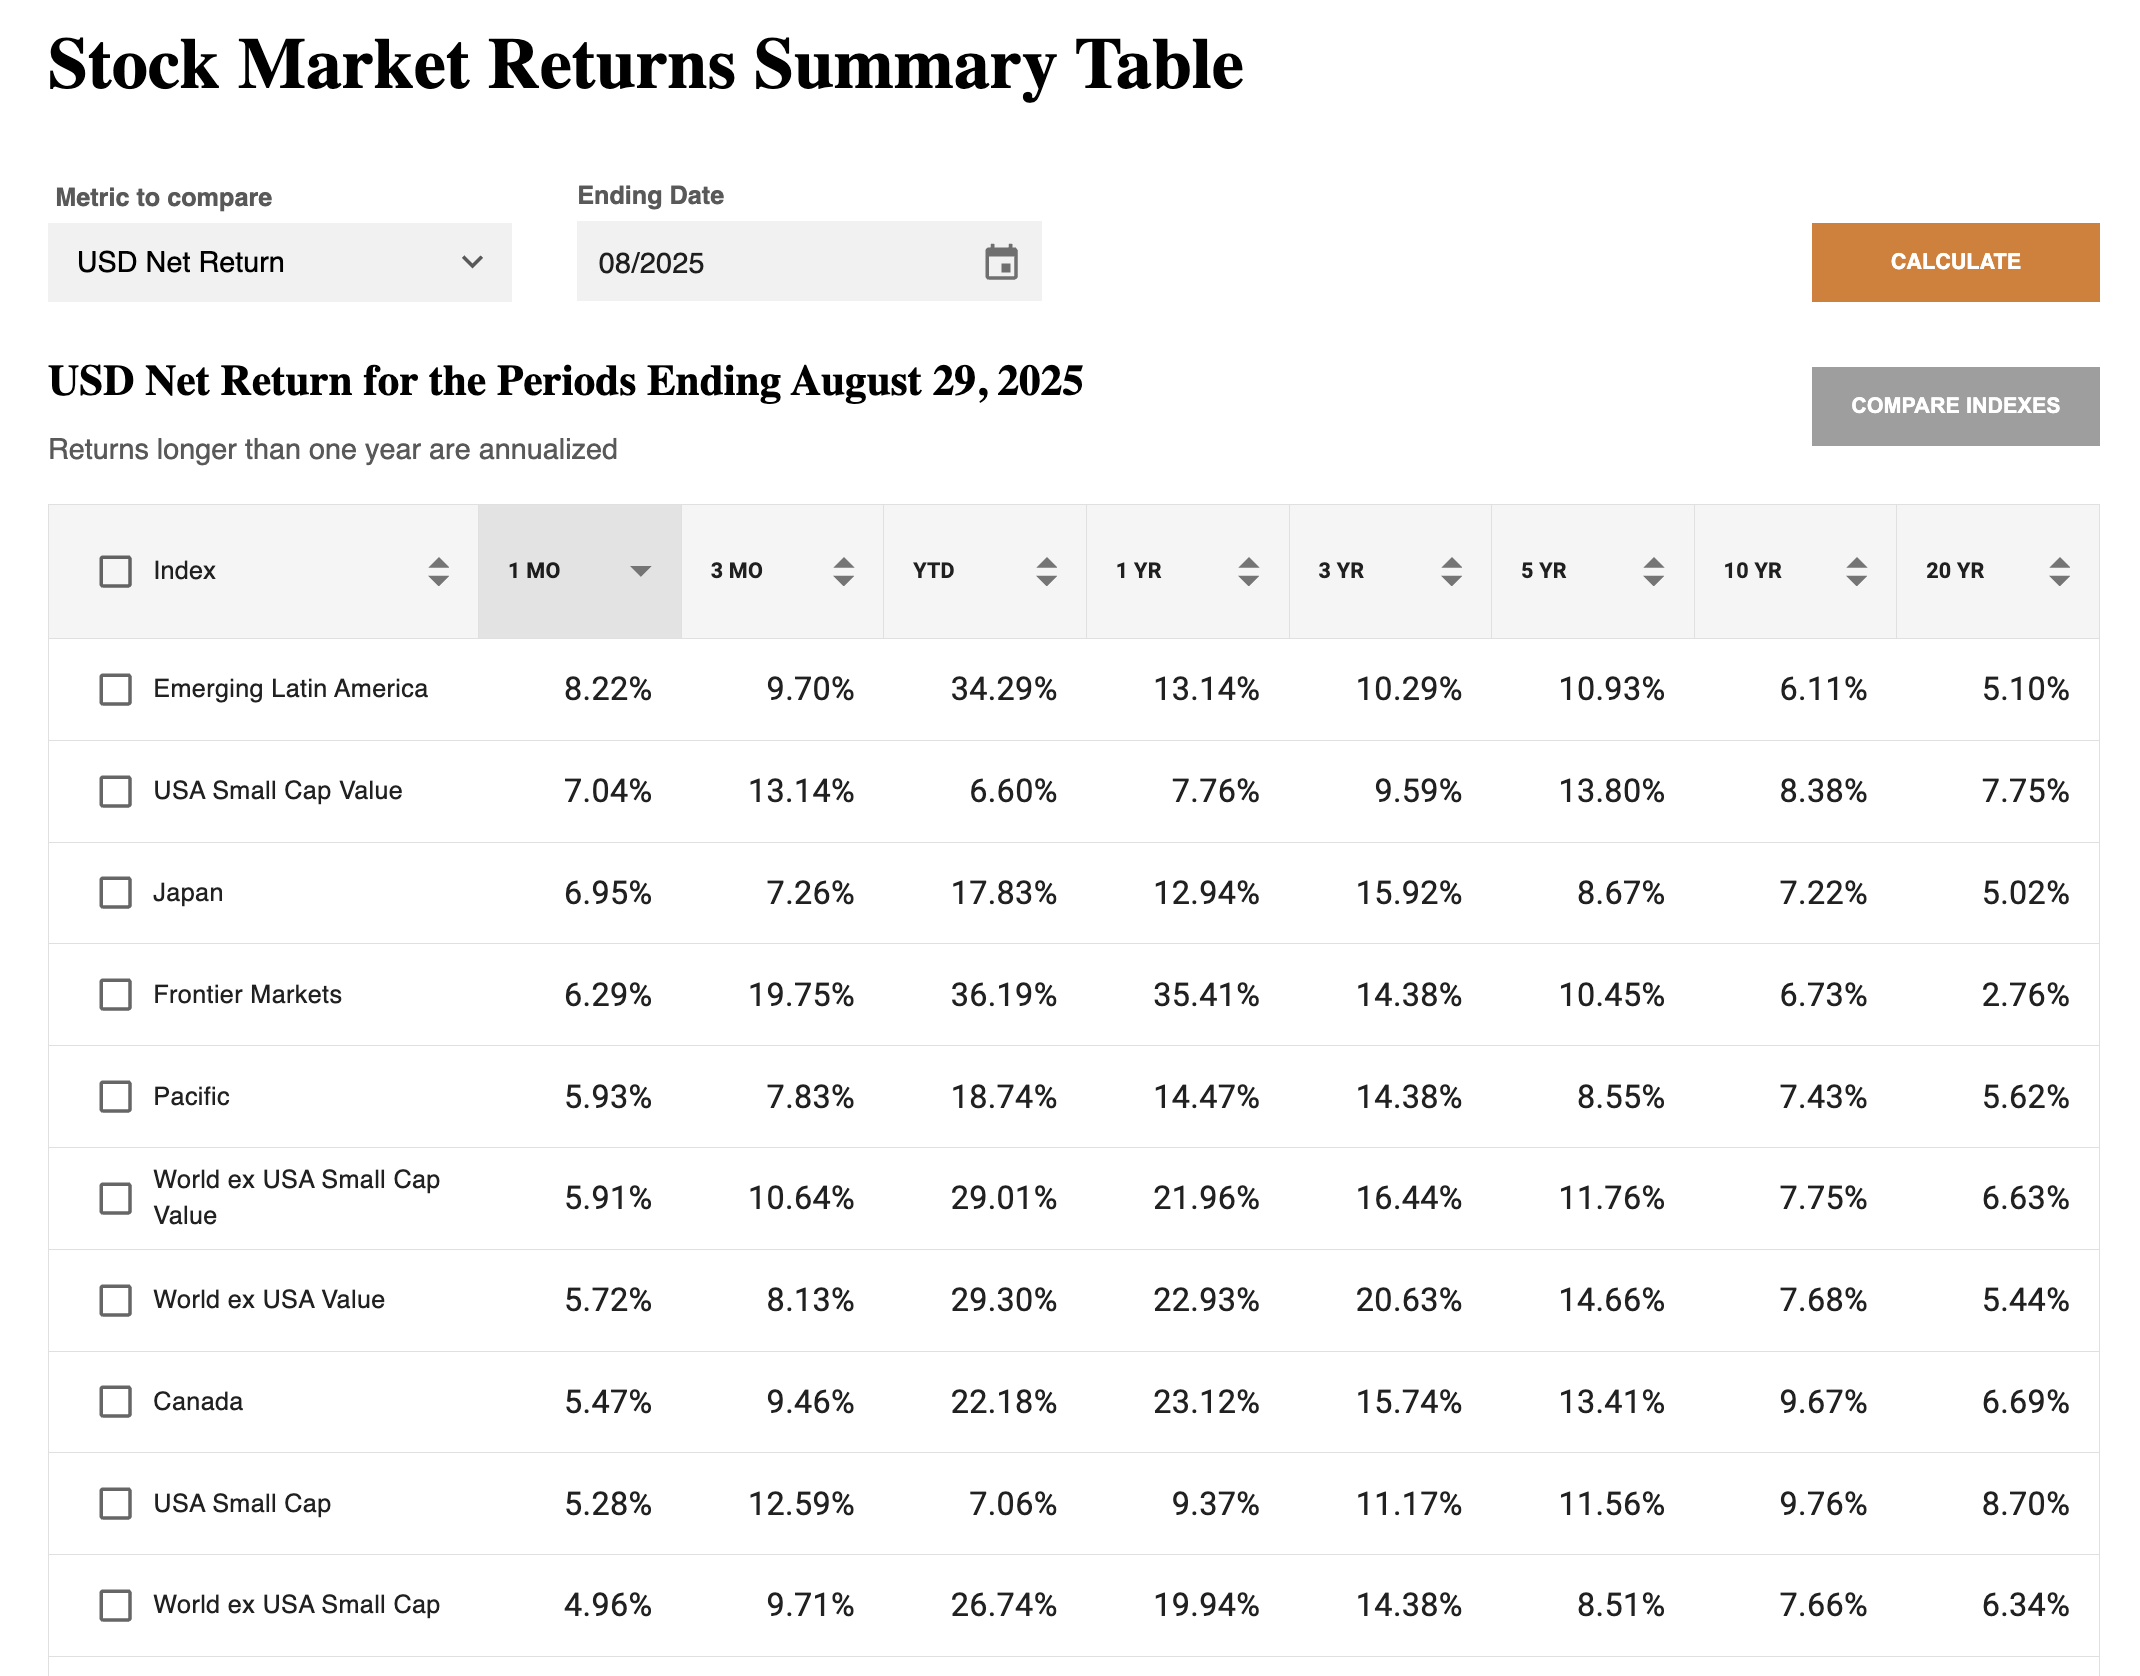
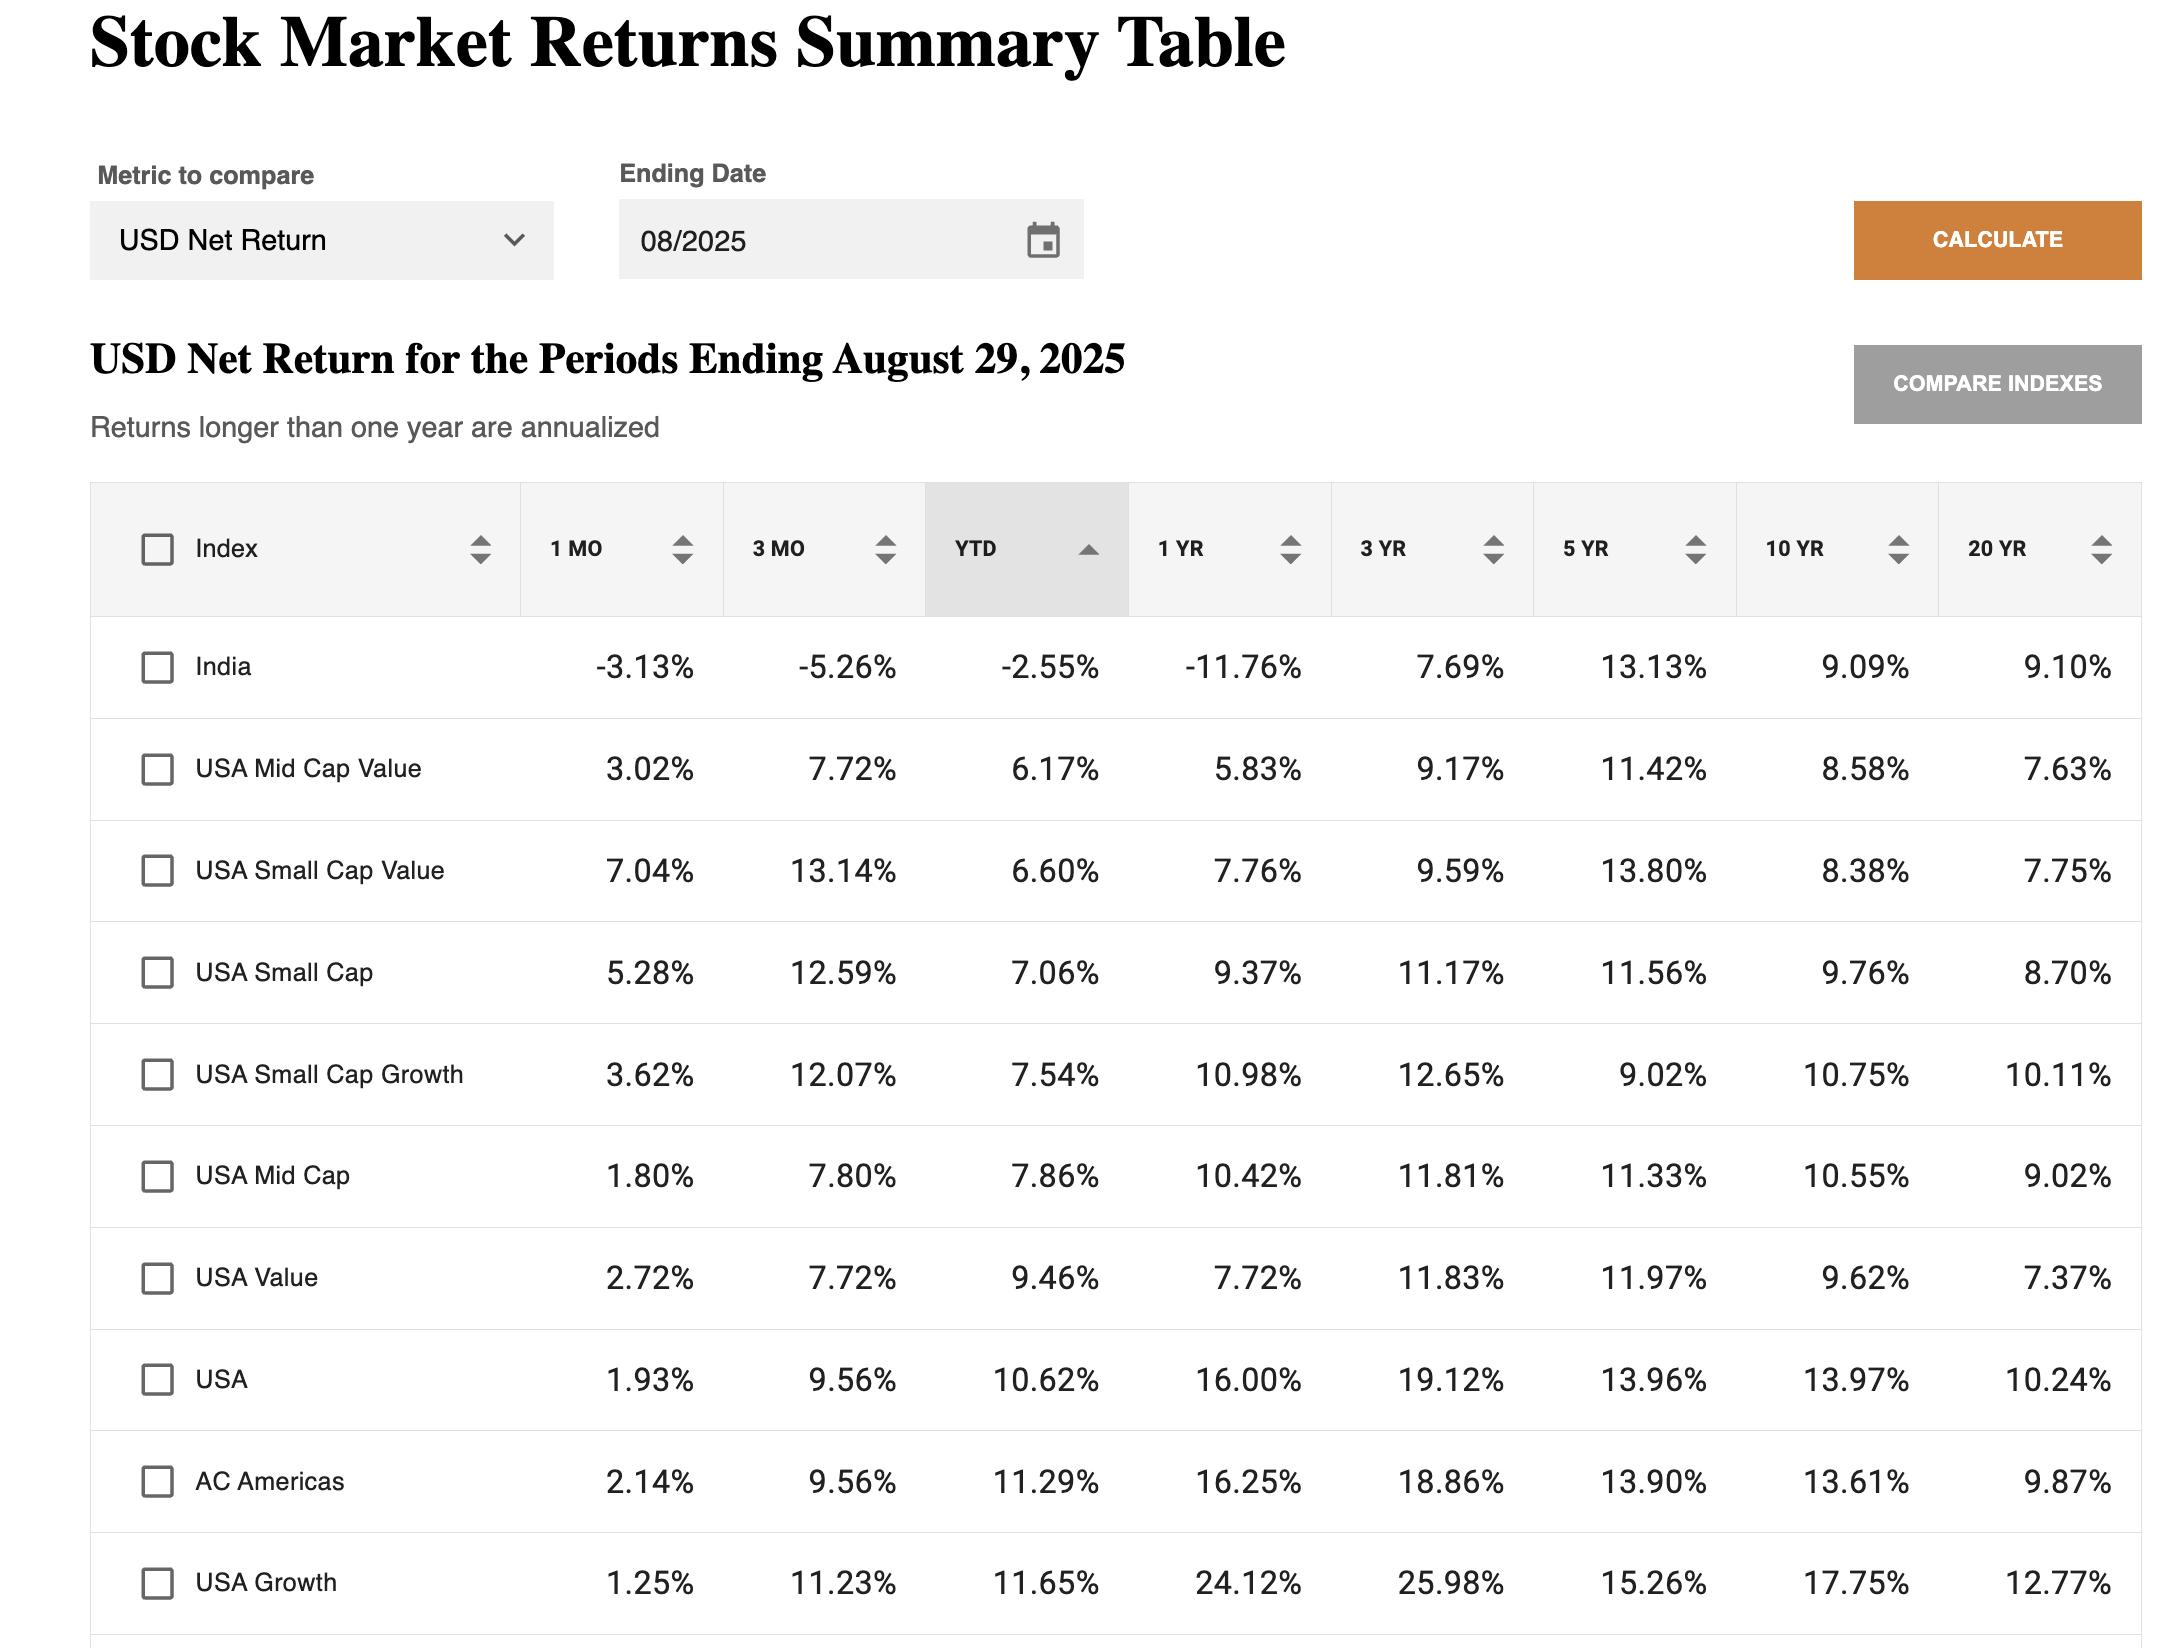
With the exception of India, U.S. stock indexes have been the worst performers year-to-date, although returns are in the high single digits to low double digits. Indian stocks sold off after the Trump Administration moved forward with its 50% tariffs on imports from India.
A number of other countries, including Japan, Canada, and Vietnam, posted strong returns in August, as the U.S. tariff impact was expected to be less severe than initially anticipated.
From a technical analysis perspective, global stocks, both in U.S. dollar and local currency terms, trade well above their 10-month moving average. The average is upward-sloping, suggesting the stock market advance remains intact, as long as the global economy holds up.

Bond Market Update
Most bond markets were positive in August as interest rates fell. The yield on the Global Aggregate Bond Index declined 11 basis points in the month.
Interest rates rose in Japan, Europe, and for longer-term U.S. Treasury bonds.

U.S. short-to-intermediate interest rates declined in August after Federal Reserve Chair Powell gave a speech at the annual Federal Reserve economic symposium in Jackson Hole, Wyoming, that suggested weaker U.S. employment growth could motivate a policy rate cut at the September meeting of the Federal Reserve Open Market Committee.
The best-performing areas of the bond market year-to-date were non-U.S. investment-grade and non-investment-grade bonds denominated in U.S. dollars, primarily due to the weakening of the U.S. dollar.
Treasury bonds with maturities of 5 to 10 years, and TIPS have also performed well this year.

Where Are We Now
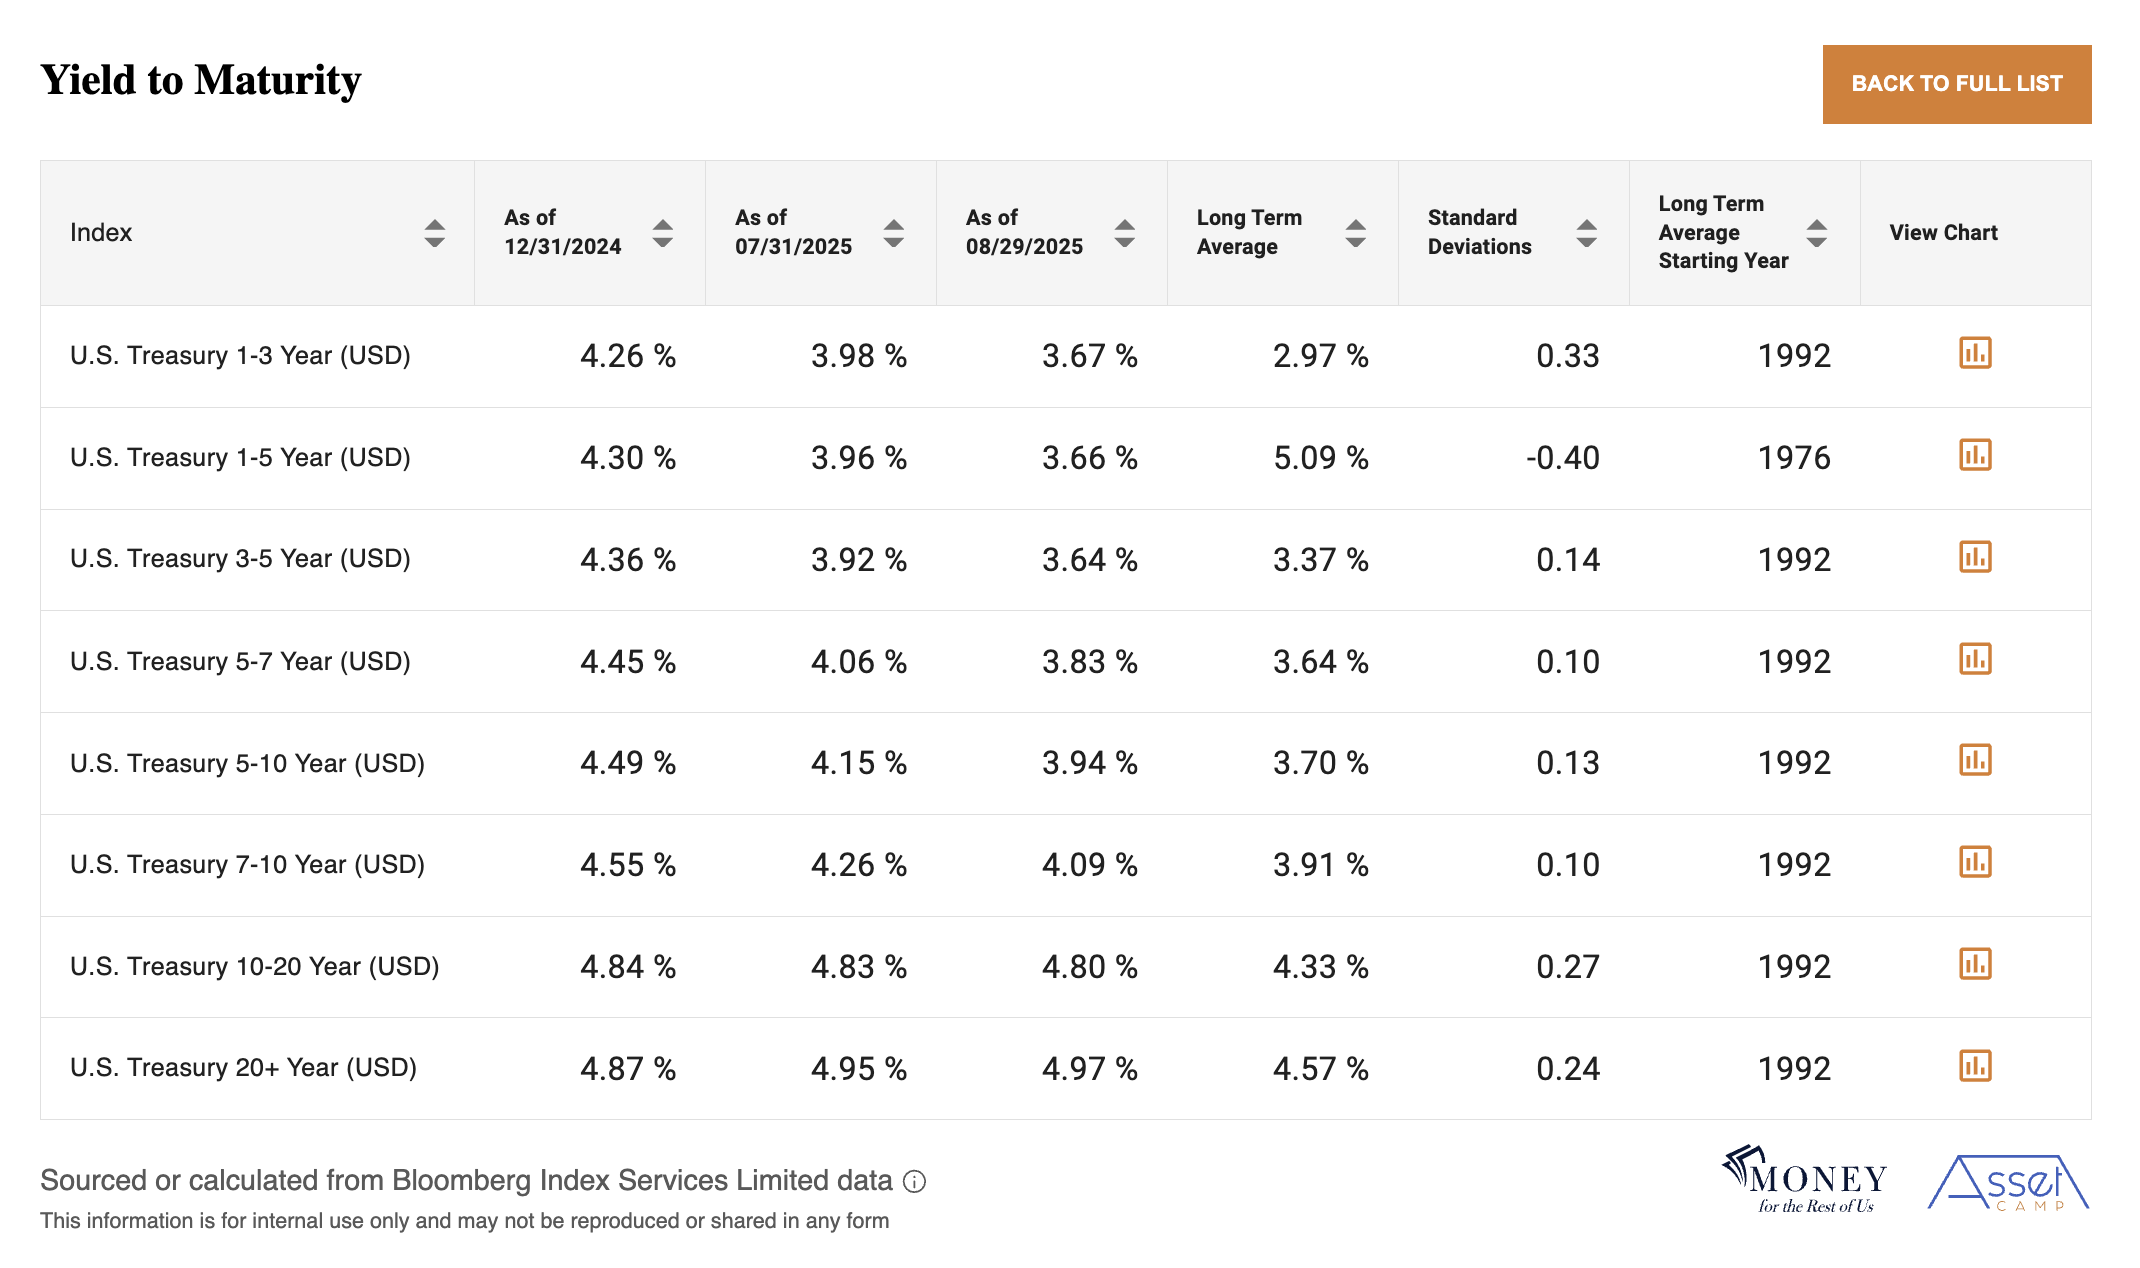
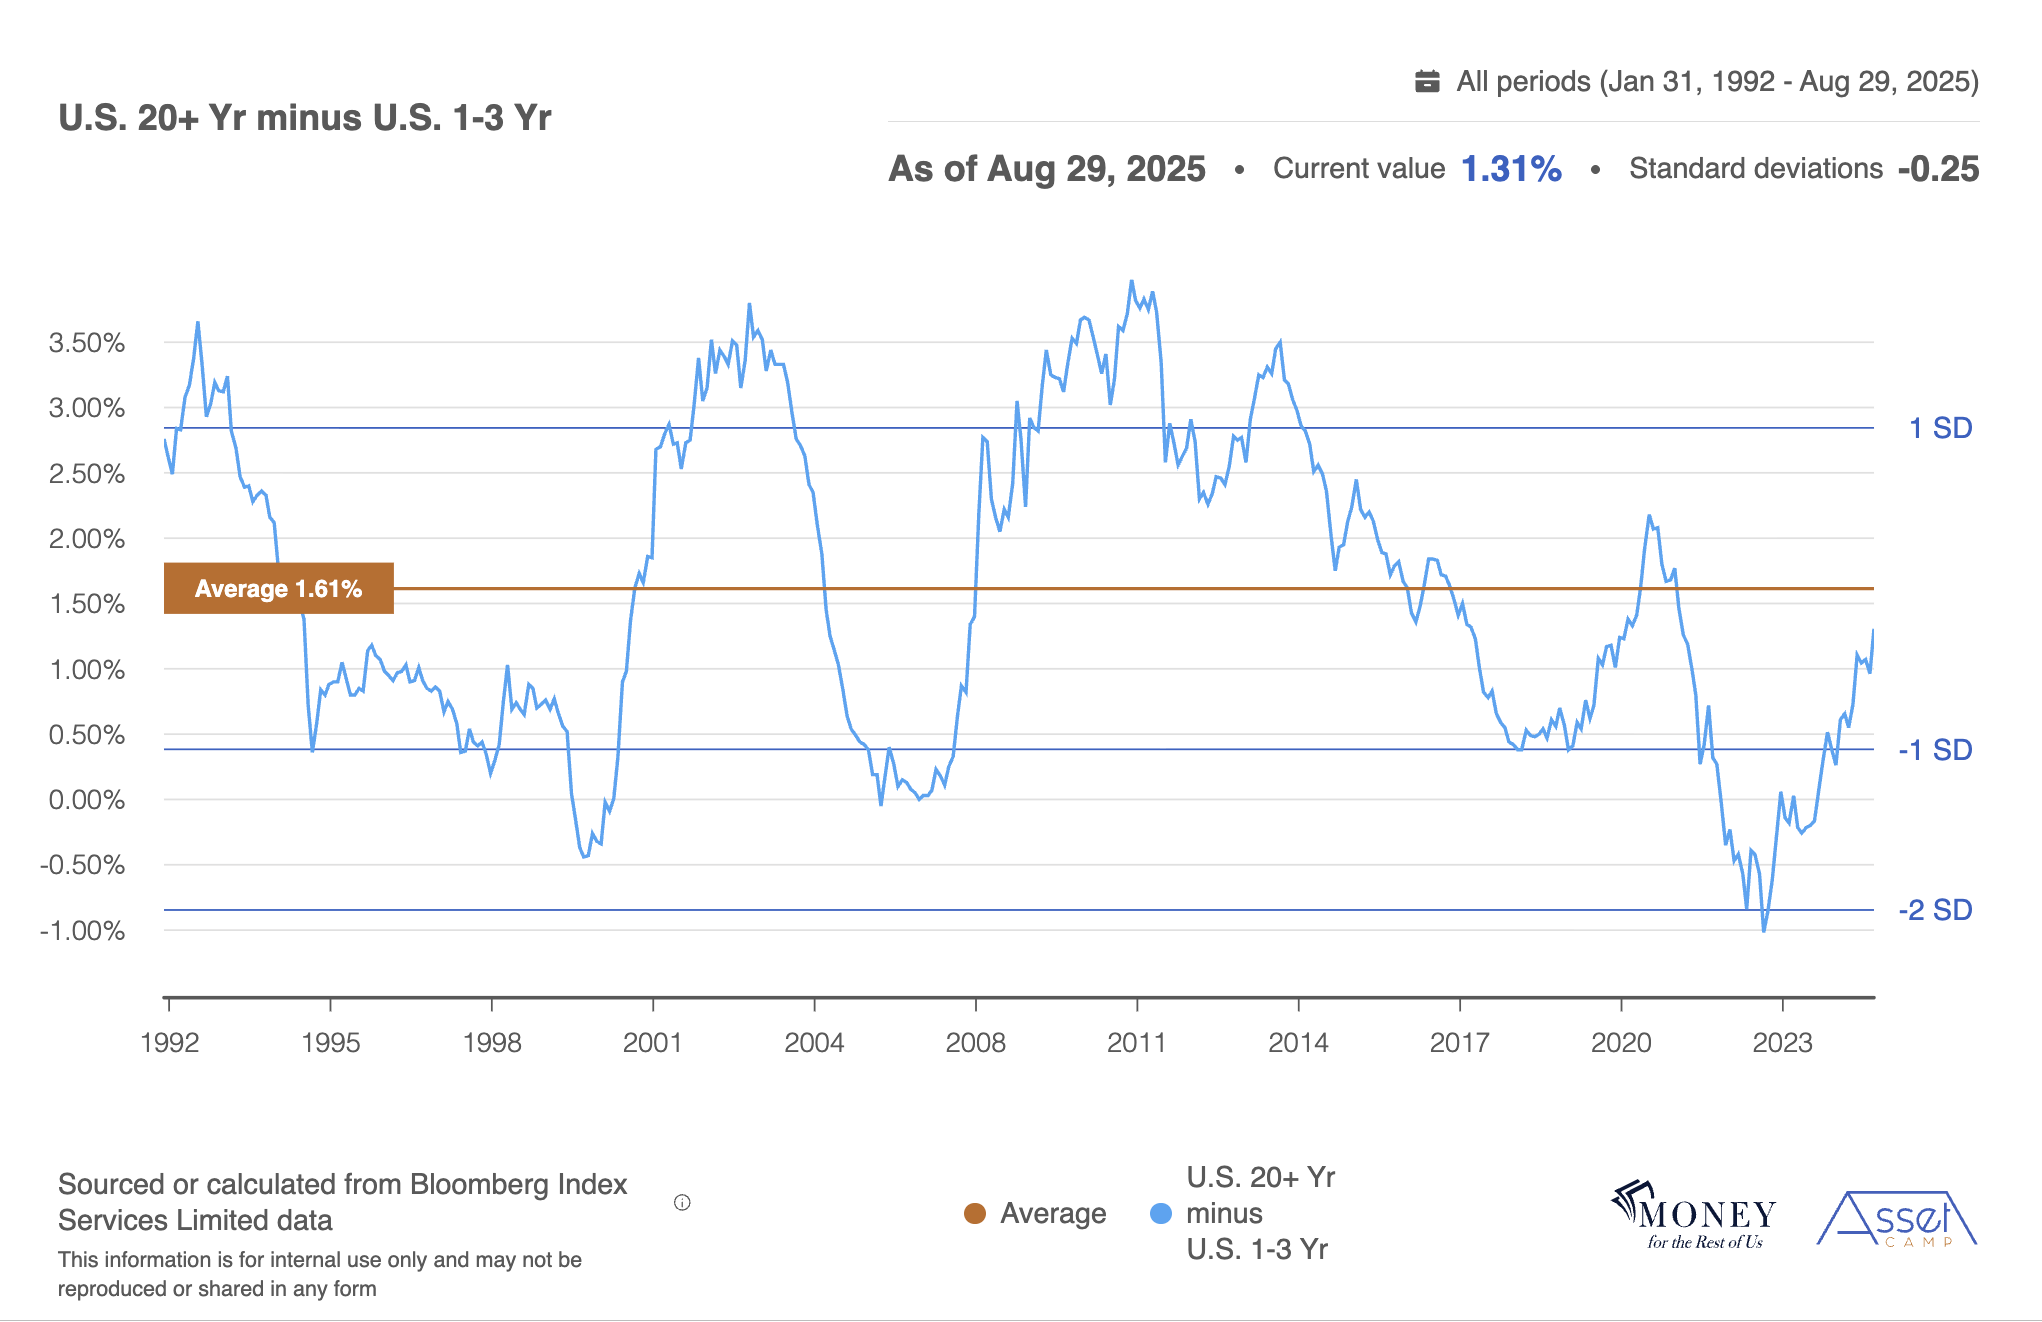
Longer-term interest rates have been rising globally. In the UK, 30-year gilt yields have climbed to 5.75%, their highest level since 1998. In the U.S., 20+ year Treasury yields are once again approaching 5%, a level they have not consistently exceeded since 2002.

With shorter-term U.S. Treasury bond yields falling while long-term yields rose, the spread between the two reached its greatest differential in three years.
France and Germany’s long-term bond yields are now at their highest in nearly 15 years, while Japan’s 30-year yield, at 3.25%, stands at a record high.
Higher longer-term rates are a function of record government bond issuance combined with investors demanding a higher term premium to compensate for uncertainty given expanding budget deficits.
This chart shows the increase in the expected term premium for U.S. bonds 10 years from now. That forward term premium is 1.3% compared to the current term premium of 0.5% for 10-year Treasury bonds.
Bond investors expect higher term premiums in the future compared to today.

Market narratives are constantly shifting, and investors have refocused their attention on government finances.
Two Recent Developments
In the U.S., several recent developments could be contributing to the modest rise in longer-term interest rates and record gold prices. Gold recently surpassed $3,500 per ounce.
First, threats to Federal Reserve independence have increased with President Trump’s firing of Board Governor Lisa Cook. The U.S. Department of Justice is investigating the Administration’s allegations that Cook committed mortgage fraud. Meanwhile, Cook, in legal filings, has denied the charges and is seeking to serve out the rest of her term as governor, which doesn’t end until 2038.
The seven Federal Reserve Board Governors serve for 14 years as a way to insulate them from political pressure to lower policy rates.
If Cook is replaced, and eventually the majority of voting members of the Federal Reserve Open Market Committee (FOMC) are Trump appointees, it is not inevitable that the FOMC will meet President Trump’s demand to lower the policy rate by three percentage points.
Each voting member still has a professional obligation to weigh the Fed’s dual mandate. Their collective judgment is likely to reflect what they perceive as the appropriate policy rate to strike a balance between maximum employment and stable prices, rather than being influenced solely by political pressure.
Still, if it becomes clear that the FOMC is succumbing to presidential pressure to lower the policy rate, that could lead to longer-term interest rates as the term premium rises. Gold would also likely increase in that scenario.
A second recent development that could be contributing to the slight increase in long-term interest rates is that the Court of Appeals for the Federal Circuit ruled 7-4 that the Trump Administration’s justification for reciprocal tariffs under the International Emergency Economic Powers Act of 1977 was “invalid” and “contrary to law.”
The tariffs will remain in effect until at least mid-October to give the U.S. Supreme Court time to rule on the case, assuming it decides to intervene.
If the tariffs are permanently suspended by the courts, the U.S. budget deficit will be higher without the hundreds of billions of dollars of additional tariff revenue. That will require additional Treasury bond issuance, potentially pushing up borrowing costs.
U.S. National Debt Dynamics
For now, U.S. borrowing costs remain manageable. The average interest rate on the national debt is about 3.4%, about one percentage point higher than the average over the past decade, but still below the annual 4.6% growth rate of nominal GDP.
A key measure for monitoring national debt risk is the publicly held debt-to-GDP ratio, which reflects the size of federal liabilities held by the public relative to the economy’s output. Each year’s budget deficit, including interest, feeds directly into this ratio. A deficit equal to 5% of GDP, for example, will raise the debt-to-GDP ratio by that amount if the economy does not grow. Conversely, if GDP growth matches the rate of debt accumulation, the ratio stabilizes.
With U.S. national debt-to-GDP approaching 100%, sustainability requires that nominal GDP growth at least match the annual deficit as a share of output. Persistent deficits well above that level will drive the ratio higher and complicate long-term fiscal management. For fiscal year 2025, the U.S. federal budget deficit to GDP will be about 5.3%, slightly higher than the 4.6% growth in nominal GDP.
Average interest costs are the other critical factor. When the government can borrow at rates below the pace of economic growth, the debt burden is more manageable. If interest costs rise toward or above the growth rate, stabilizing the debt-to-GDP ratio will require deeper deficit reduction.
The U.S. national debt situation would be much more concerning if 20+ year Treasury yields exceeded 6% and 7-to-10 year Treasury yields exceeded 5%. Interest rates have not consistently surpassed those levels since 2000, a period when publicly held debt-to-GDP was less than 40%. The 10-year term premium was 1% higher back then than today. Consequently, if the U.S. term premium jumped to 1.5% that would send 20+ year Treasuries to 6% and 10-year Treasuries to over 5%, levels that would have serious adverse effects on the sustainability of the U.S. national debt.

Economic Trends
Despite some modest increases in long-term interest rates, global stock and bond markets have posted strong returns in 2025 because the global economy remains on solid footing.
Leading economic indicators improved again and are at the highest level since June 2024, as measured by the JP Morgan Composite PMI business survey, which includes both manufacturing and services businesses.
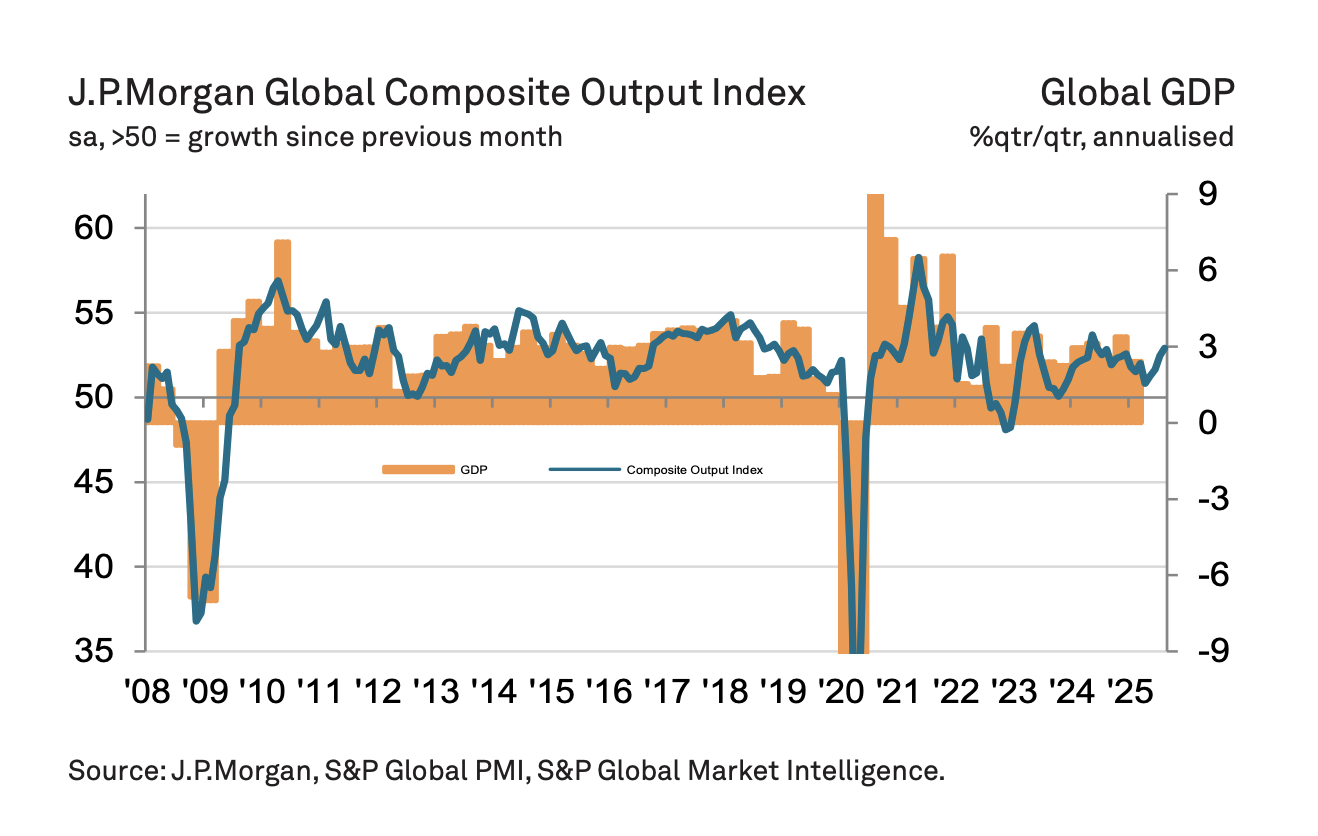
Businesses indicated higher output and new orders, leading to higher levels of employment. The direct and indirect impacts of the massive AI data center buildout that we discussed in last month’s strategy report have likely contributed to favorable economic trends.
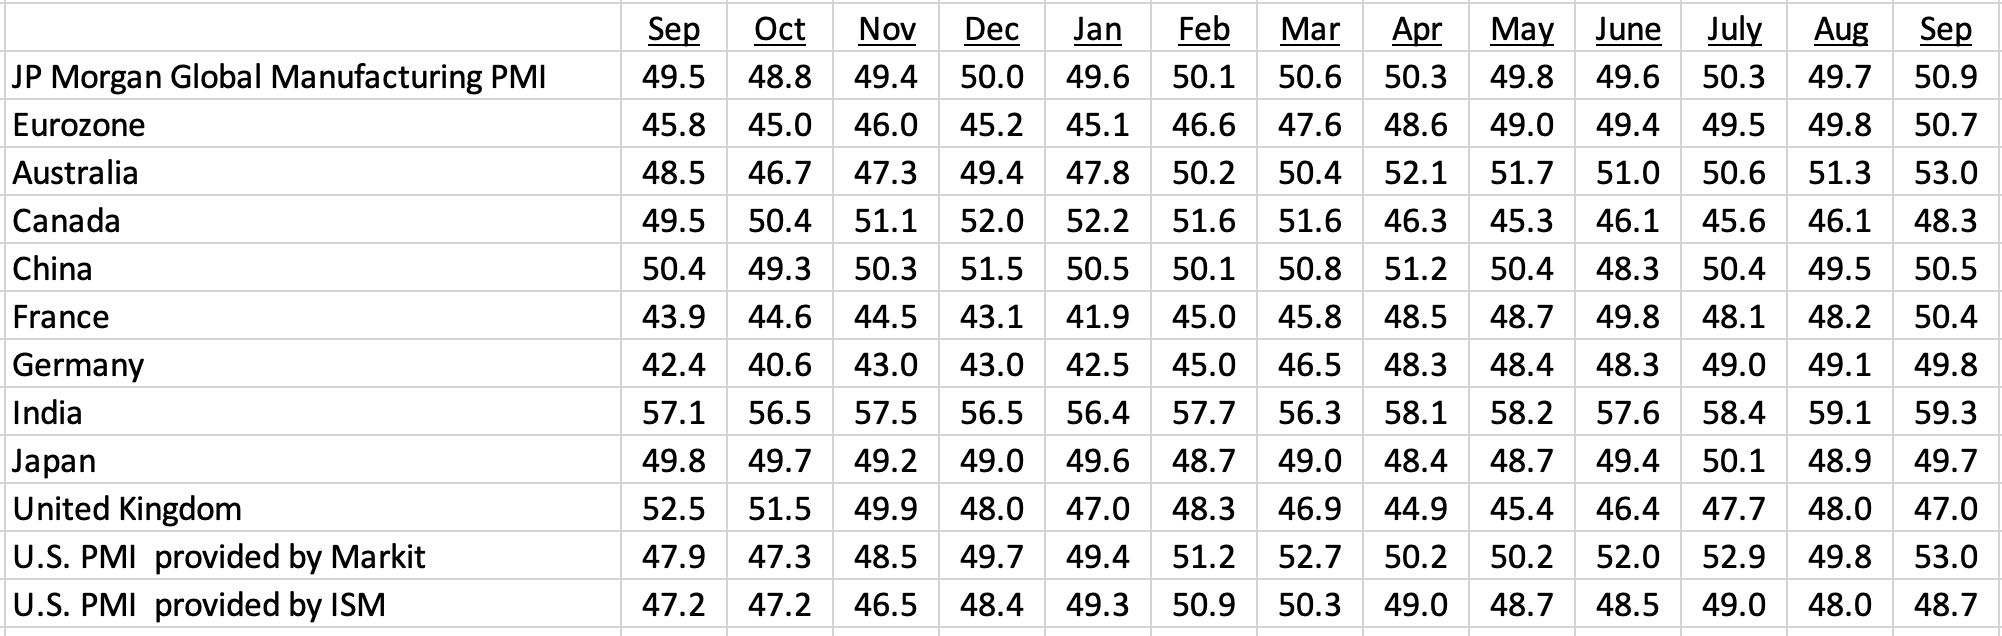
Manufacturing PMI
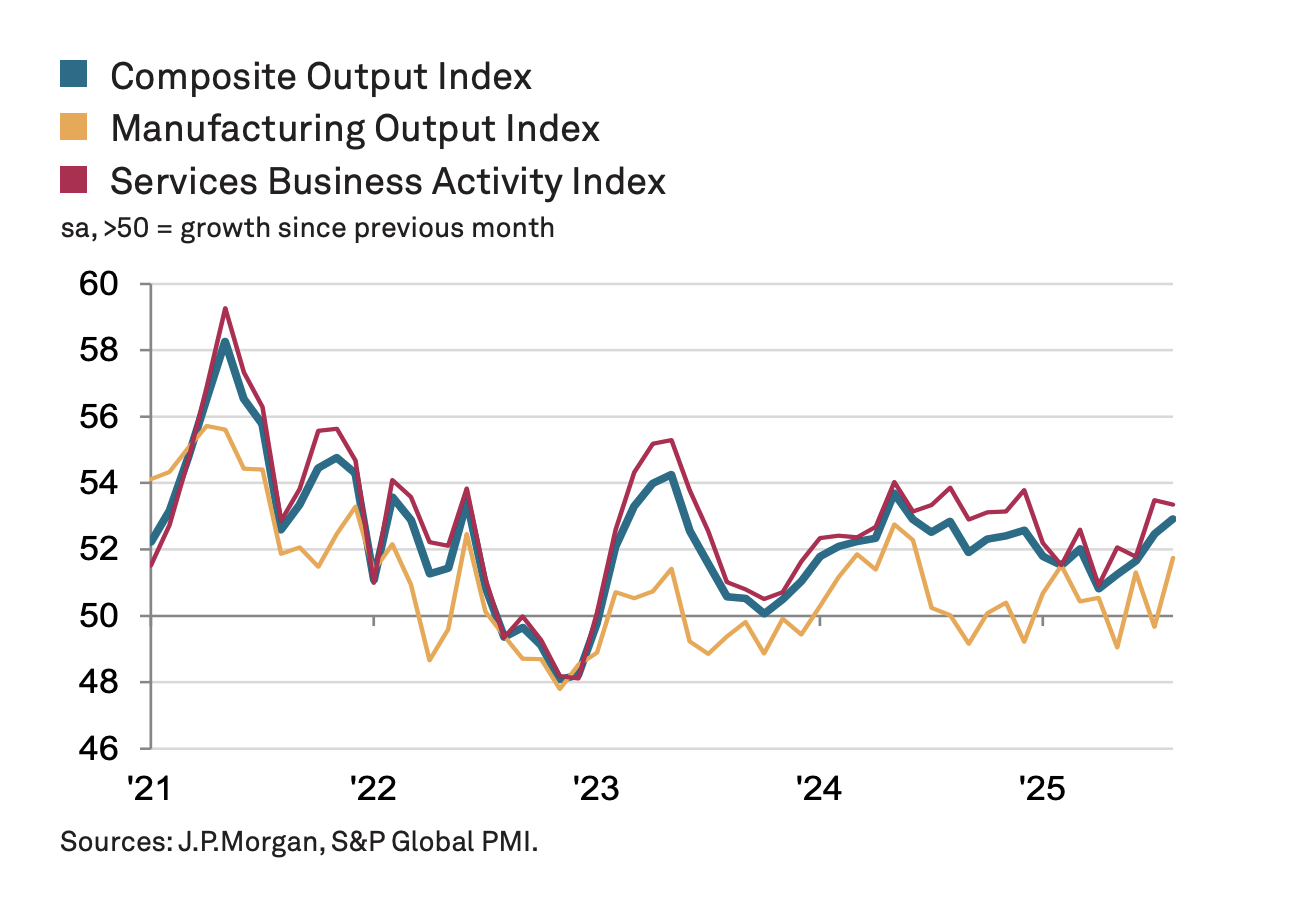
Services PMI
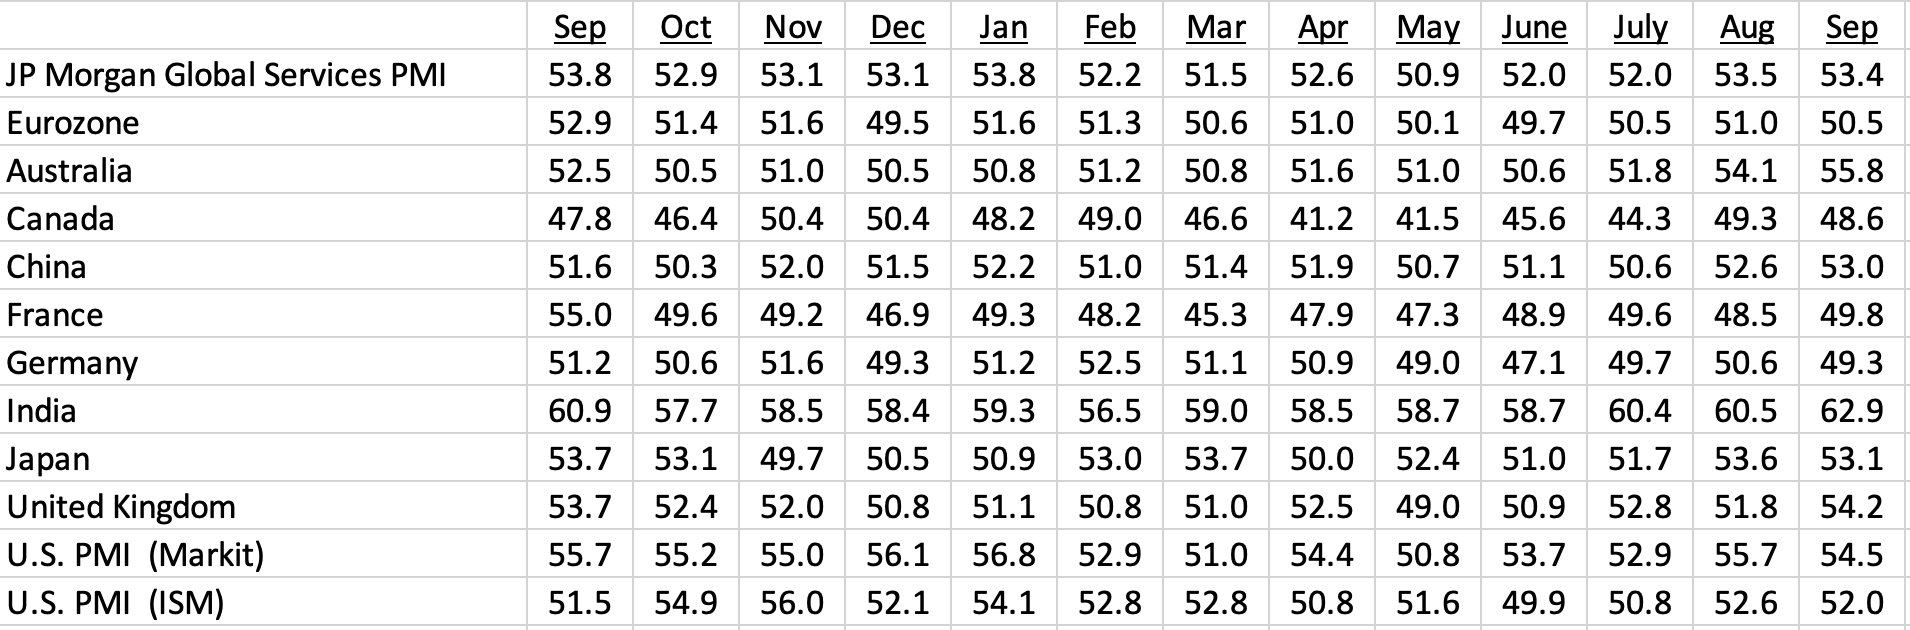
Despite the strength of current conditions, business-level confidence based on PMI survey responses is at one of the lowest levels since the pandemic. Geopolitical worries and trade policy are the primary reasons given for the lack of confidence.
That uncertainty is showing up in lackluster employment growth in the U.S. The latest U.S. jobs report still shows a low unemployment rate of 4.3%, but the number of new jobs created has been close to zero since April. That suggests more of a no-hiring, no-firing market, consistent with high levels of uncertainty, rather than a severe economic downturn, especially in light of favorable PMI data.
The weak U.S. employment report all but guarantees the Federal Reserve will lower its policy rate at its meeting this month. The forthcoming September inflation report will confirm whether the policy rate cut will be 0.25% or 0.5%.
Corporate Earnings
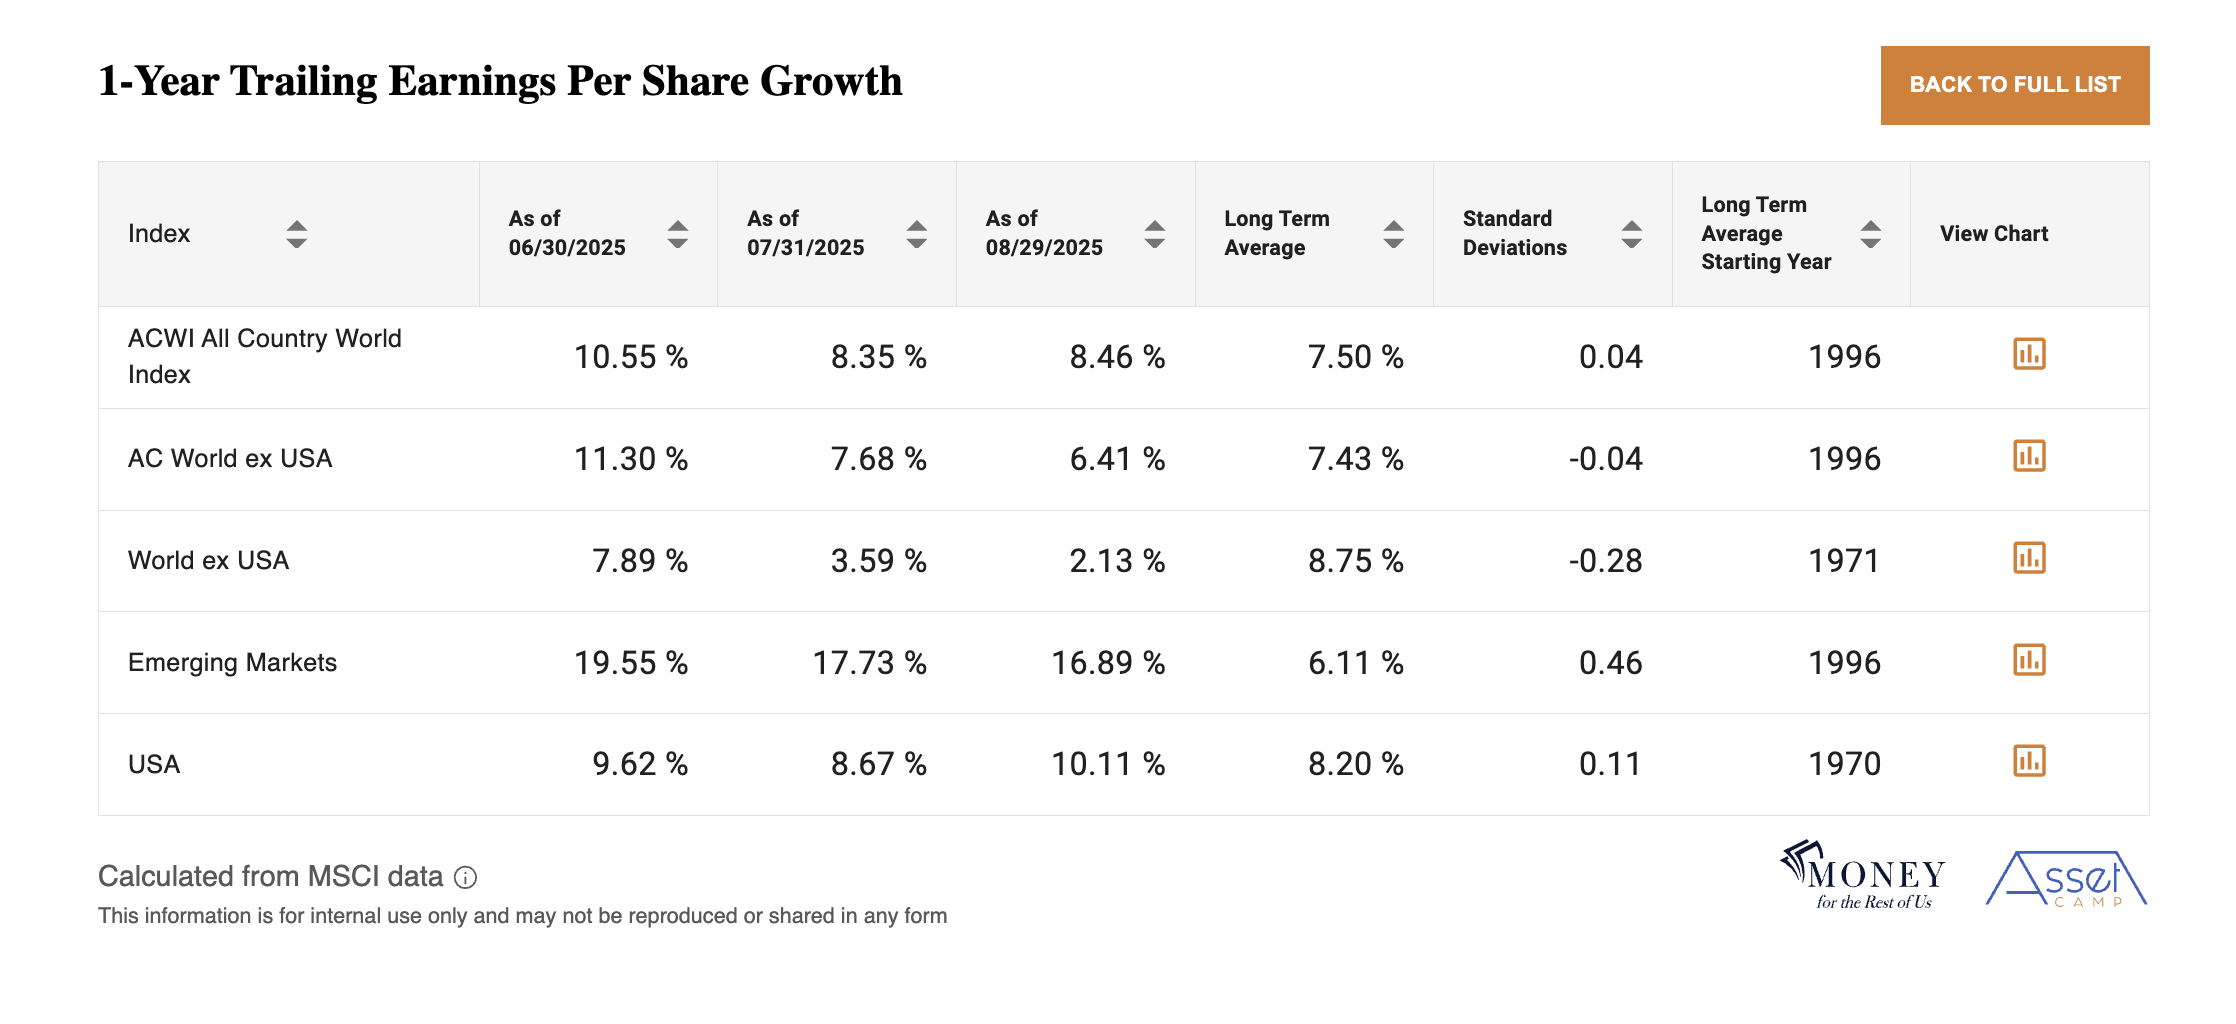
Global earnings per share growth held steady at 8.5% for the year ending August 2025, led by the U.S. and emerging markets. Developed market earnings outside of the U.S. grew only 2.1% in the past year.
Where Are We Heading
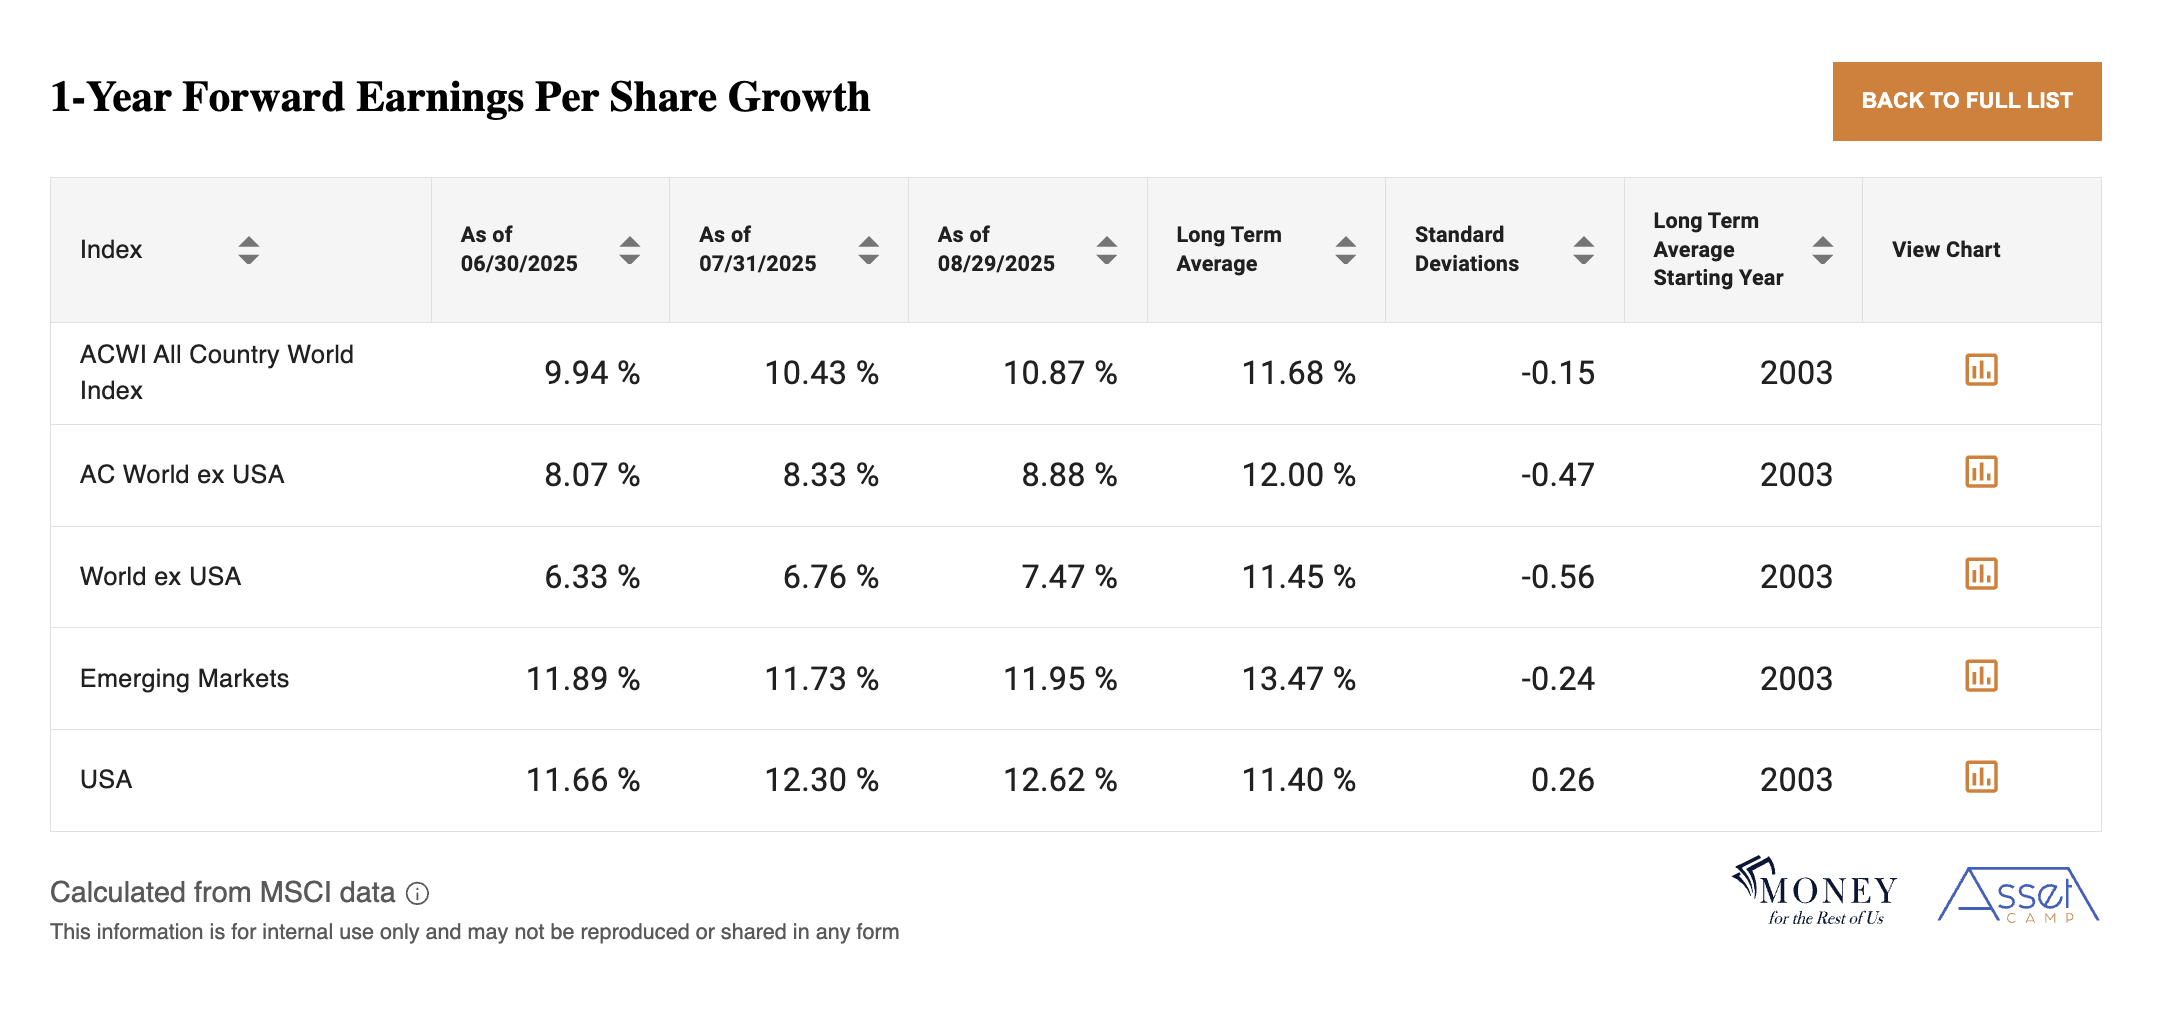
Looking forward, global earnings per share are expected to grow 10.9% over the next 12 months, led by double-digit earnings expectations for the U.S. and emerging markets.
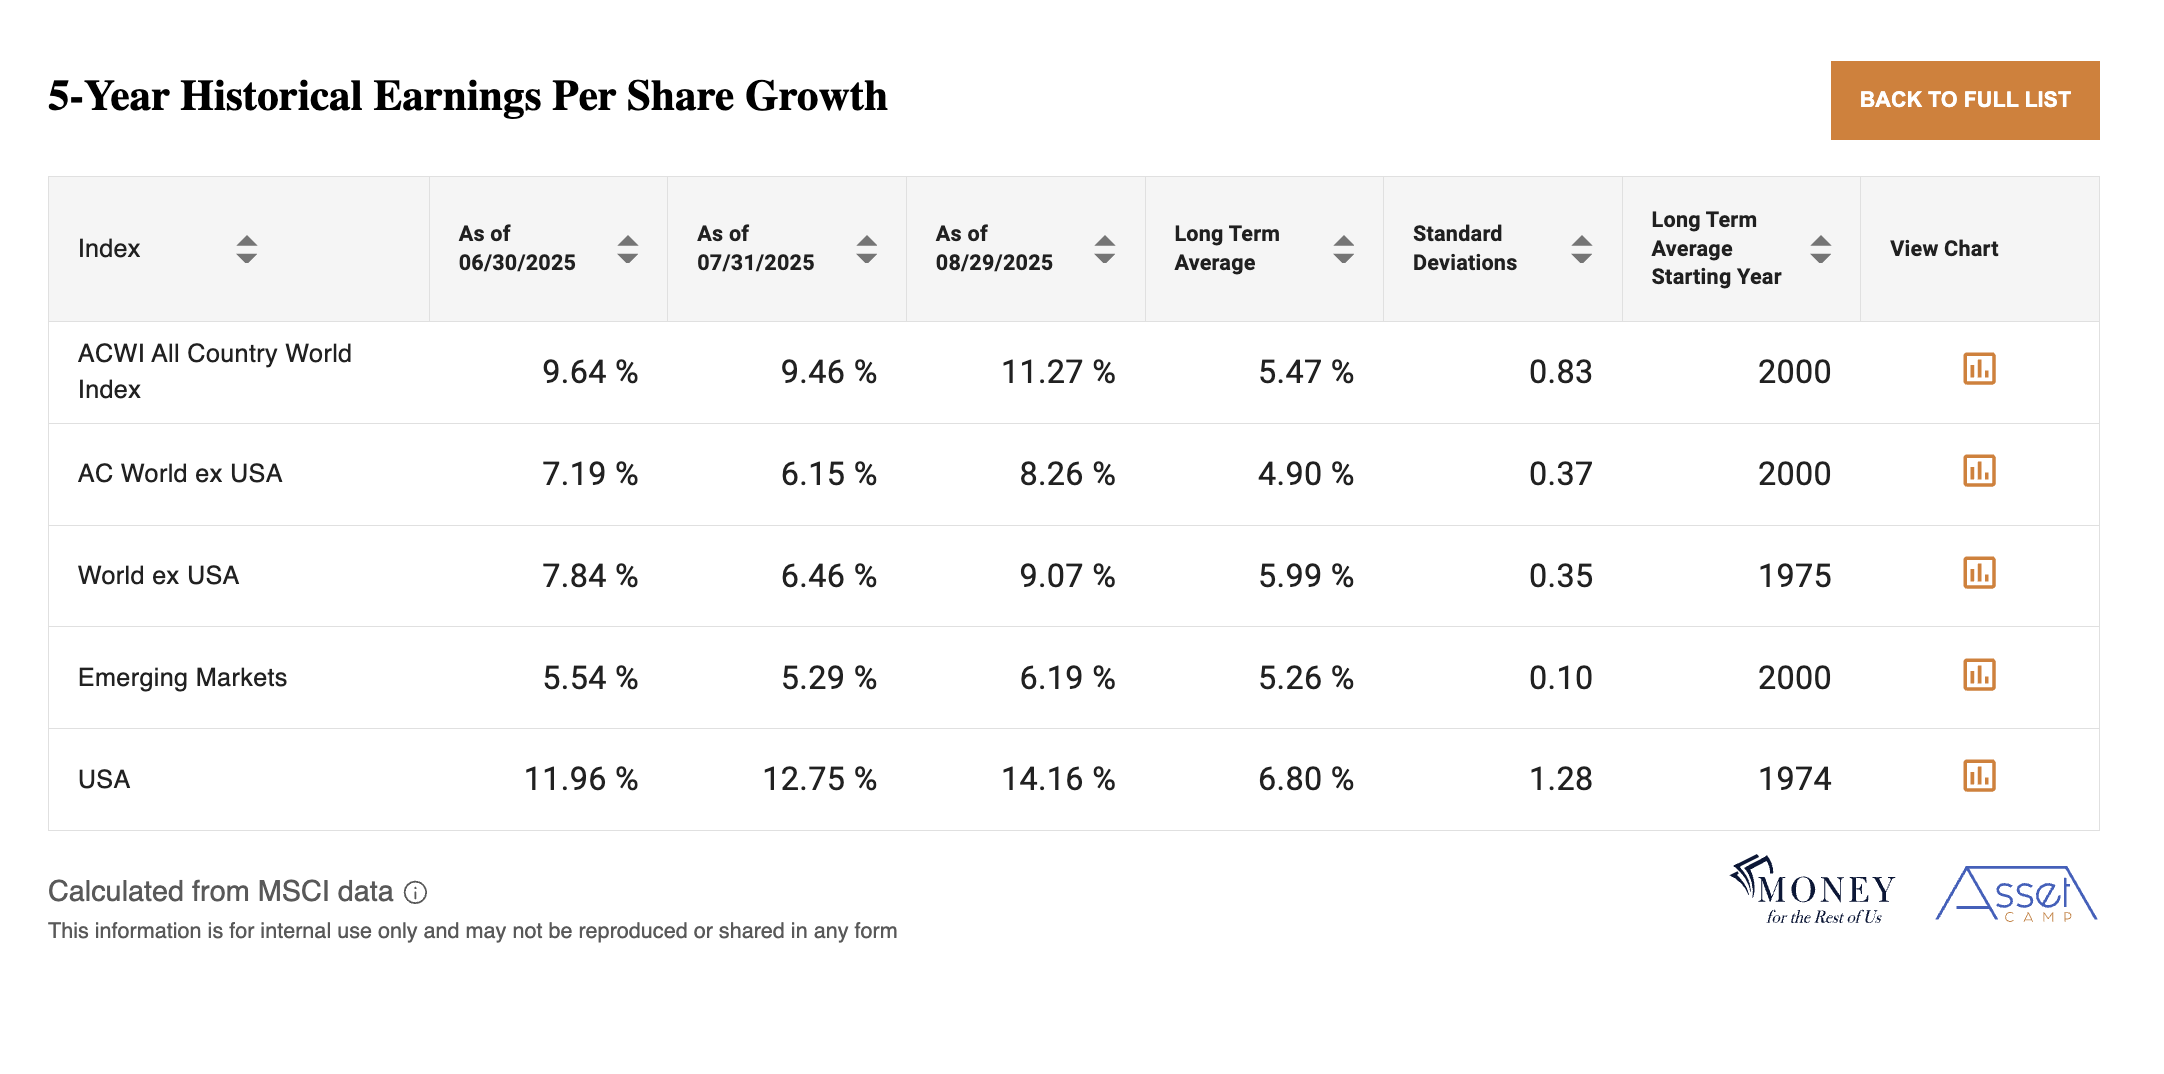
Analysts are even more bullish regarding earnings per share growth over the next three to five years.

What is notable is that five-year earnings expectations are not meaningfully different than the five-year earnings expectations from five years ago.
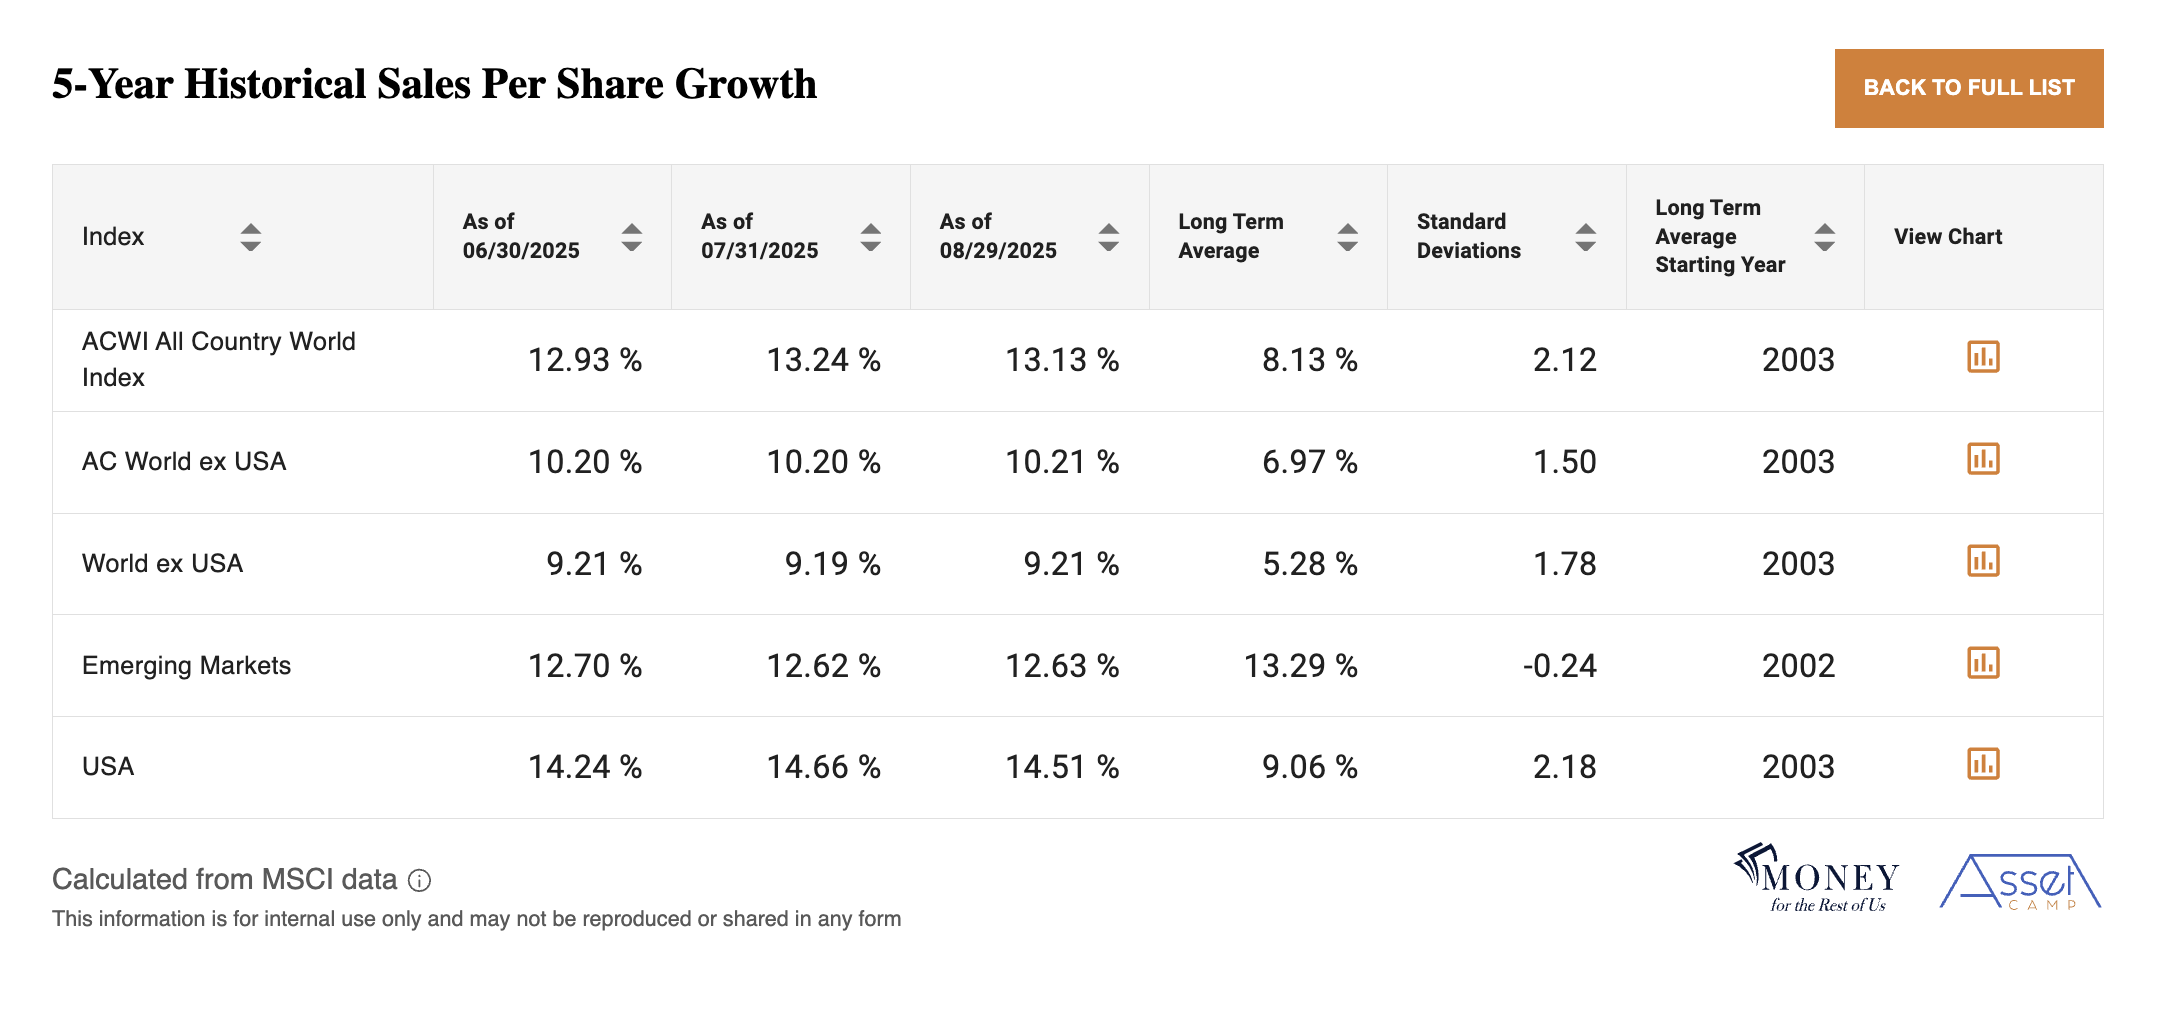
Those bullish predictions came to fruition as actual earnings and sales growth over the past five years were above long-term averages, given the economic tailwind coming out of the recession.
Asset Class Valuations
Today’s elevated earnings expectations are based on productivity increases that assume companies can successfully implement AI into their work processes.
U.S. stocks are the epicenter of AI bullishness, both in terms of expected earnings per share growth and valuations.

U.S. stocks are priced at 36 times 10-year inflation-adjusted earnings. That is 1.7 standard deviations more expensive than average. Those rich valuations are still lower than the peaks achieved in 2000, when the U.S. cyclically adjusted P/E ratio was over 40.

Non-U.S. and small-cap stocks have more compelling valuations and will also benefit from continued AI advances.
Investors who allocate to less expensive areas of the market can still benefit from AI’s promise while maintaining greater downside protection if expectations fall short.
Portfolio Positioning
Investors should maintain strategic exposure to risk assets while remaining mindful of valuation and geopolitical risks.
U.S. large-cap stocks remain expensive relative to history, supporting an underweight stance. Non-U.S. stocks, including small caps, continue to offer more compelling valuations.
Still, with the U.S. comprising 65% of the global stock market, investors should maintain a meaningful allocation to the country’s stock market given the nation’s economic dynamism, especially given its role in the AI buildout.
In fixed income, investors can still earn positive real returns with short-duration instruments, including cash. Bullet ETFs and individual bonds, including Treasury Inflation Protection Securities, present attractive opportunities to lock in yields, and to benefit from price appreciation if interest rates fall.
Long-duration bonds remain vulnerable to interest rate risk, particularly if government fiscal concerns dominate the fixed-income narrative, resulting in higher term premiums.
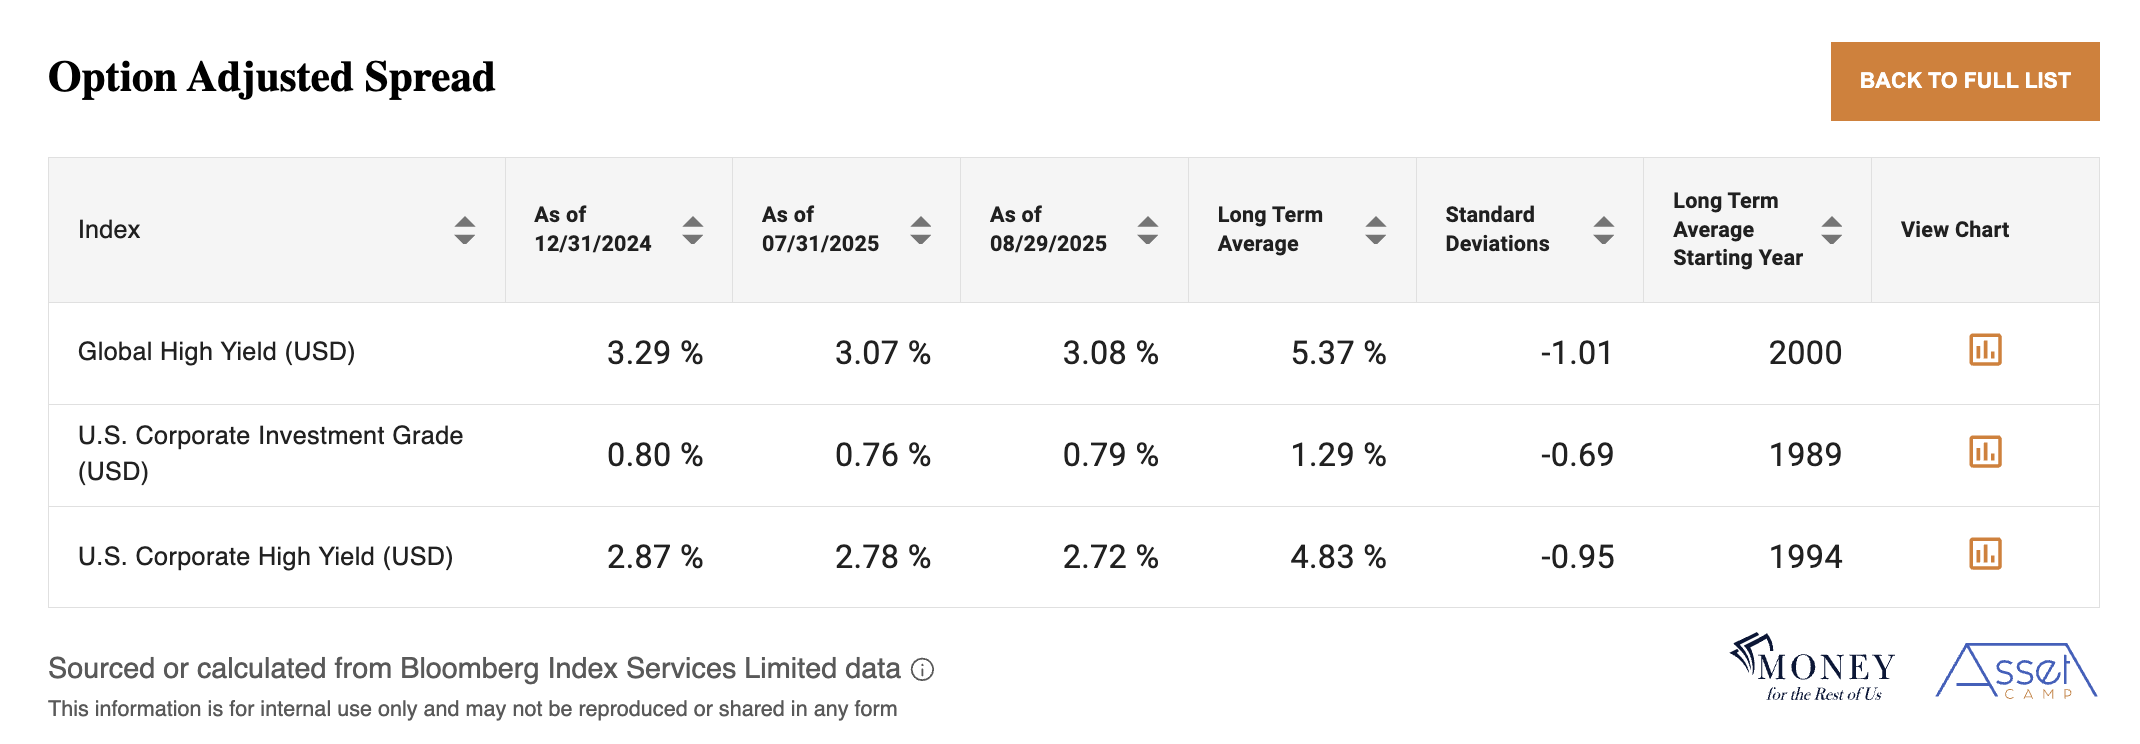
Credit markets offer relatively high nominal yields, but widening spreads and rising default rates could subtract several percentage points from returns if the global economy slows. Higher-rated collateralized loan obligations provide a more resilient way to participate in credit markets.
We will continue to monitor market conditions and political developments to evaluate whether portfolio adjustments are necessary. Particular attention will be given to the U.S. employment outlook, where it remains unclear whether recent weakness reflects a temporary pause in hiring during AI adoption or signals more persistent economic stress. We are also tracking tariff-related developments, including signs that companies are passing on higher costs through increased prices.
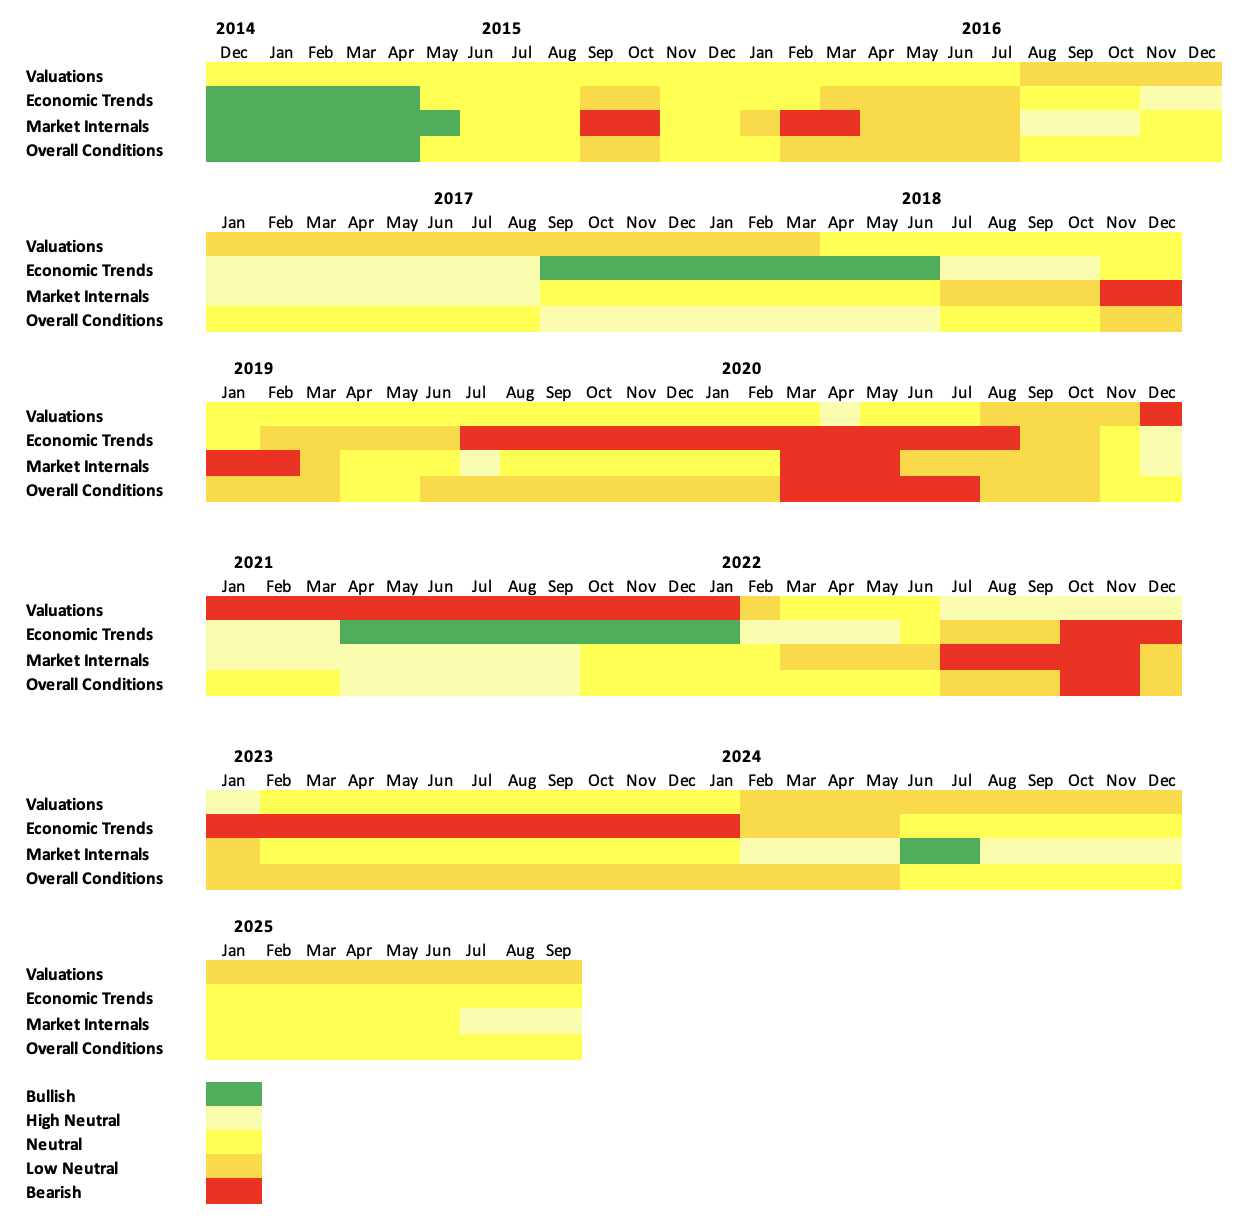
Investment Conditions Summary